Our cities are getting warmer. How does this affect us and how can we adapt?
connecting science and technology to the everyday experiences of city residents to build an informed and empowered community
Aim – Why was this website created?
The CityZcan Urban Heat Hub was created to show, in an easy-to-understand way and based on reliable data, how the urban heat island phenomenon shapes our everyday lives and what tools and community initiatives can be used to reduce its effects.
Everything in one place
Our research results
include drone and thermal camera surveys, portable sensor boxes, and analyzing scripts
Interactive heat maps and apps
to explore heat stress in your environment.
Practical guides and game-based learning tools
to ensure that adaptation is an enjoyable experience, not a chore.


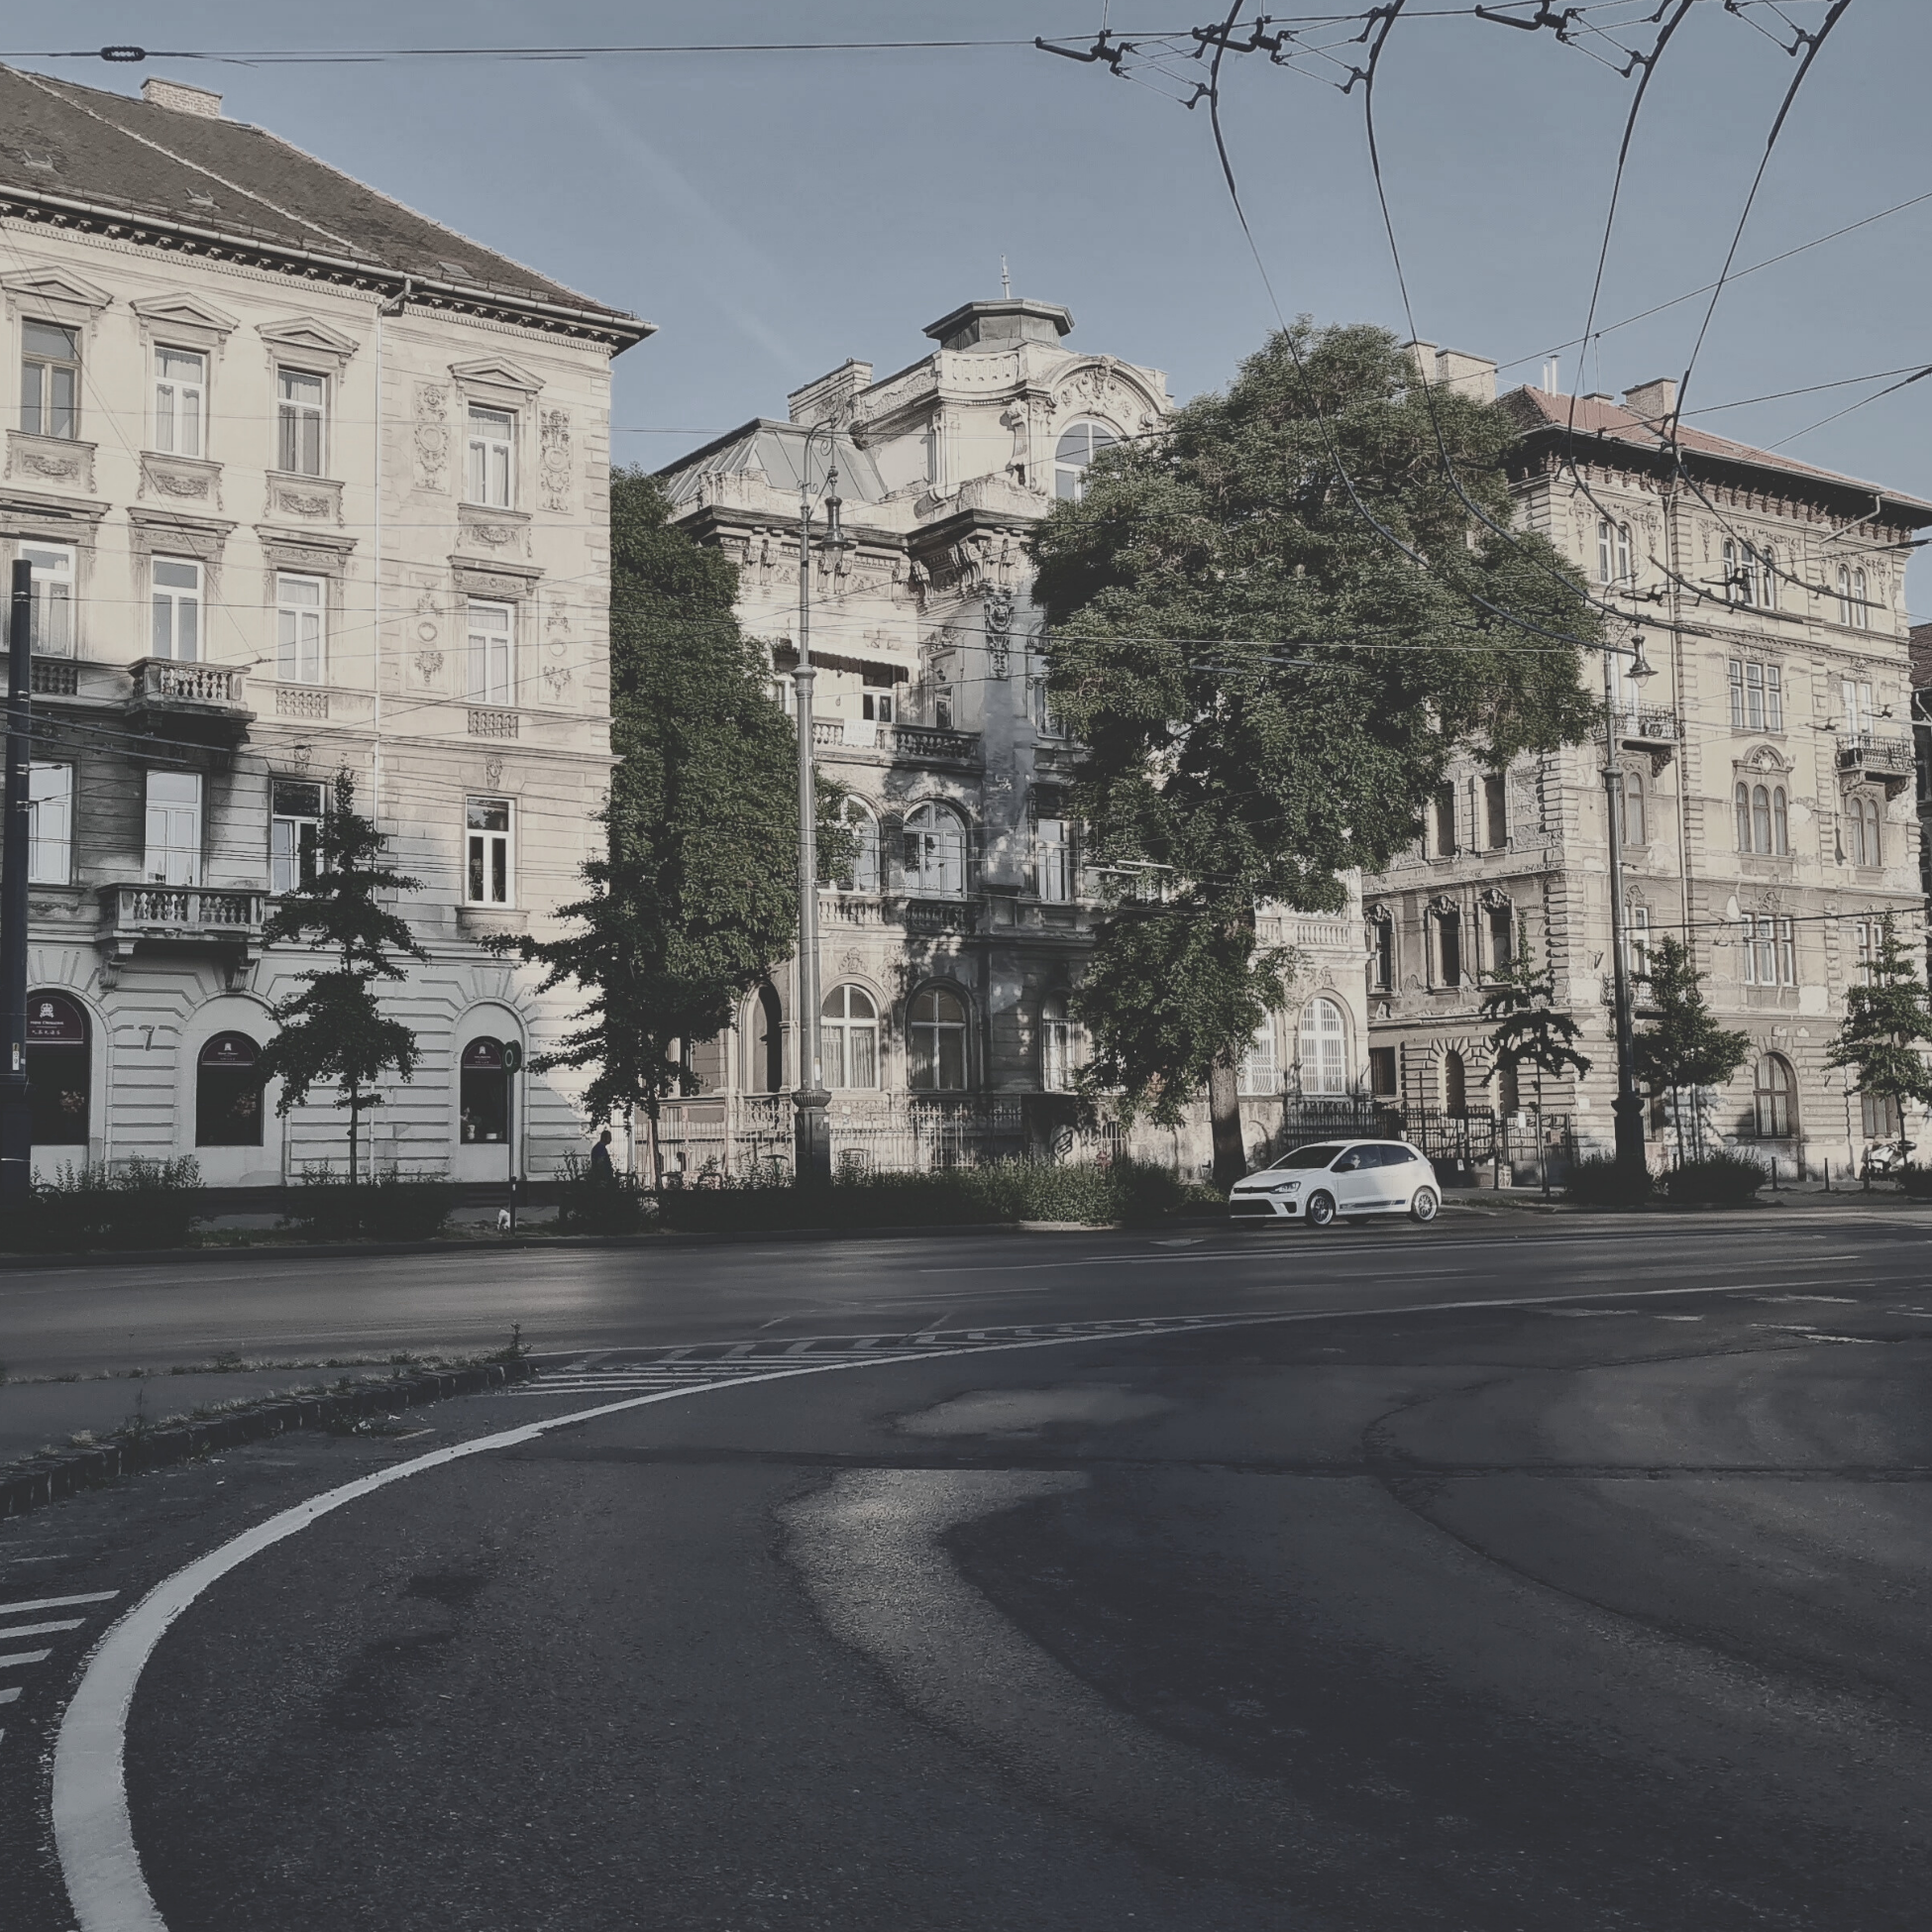
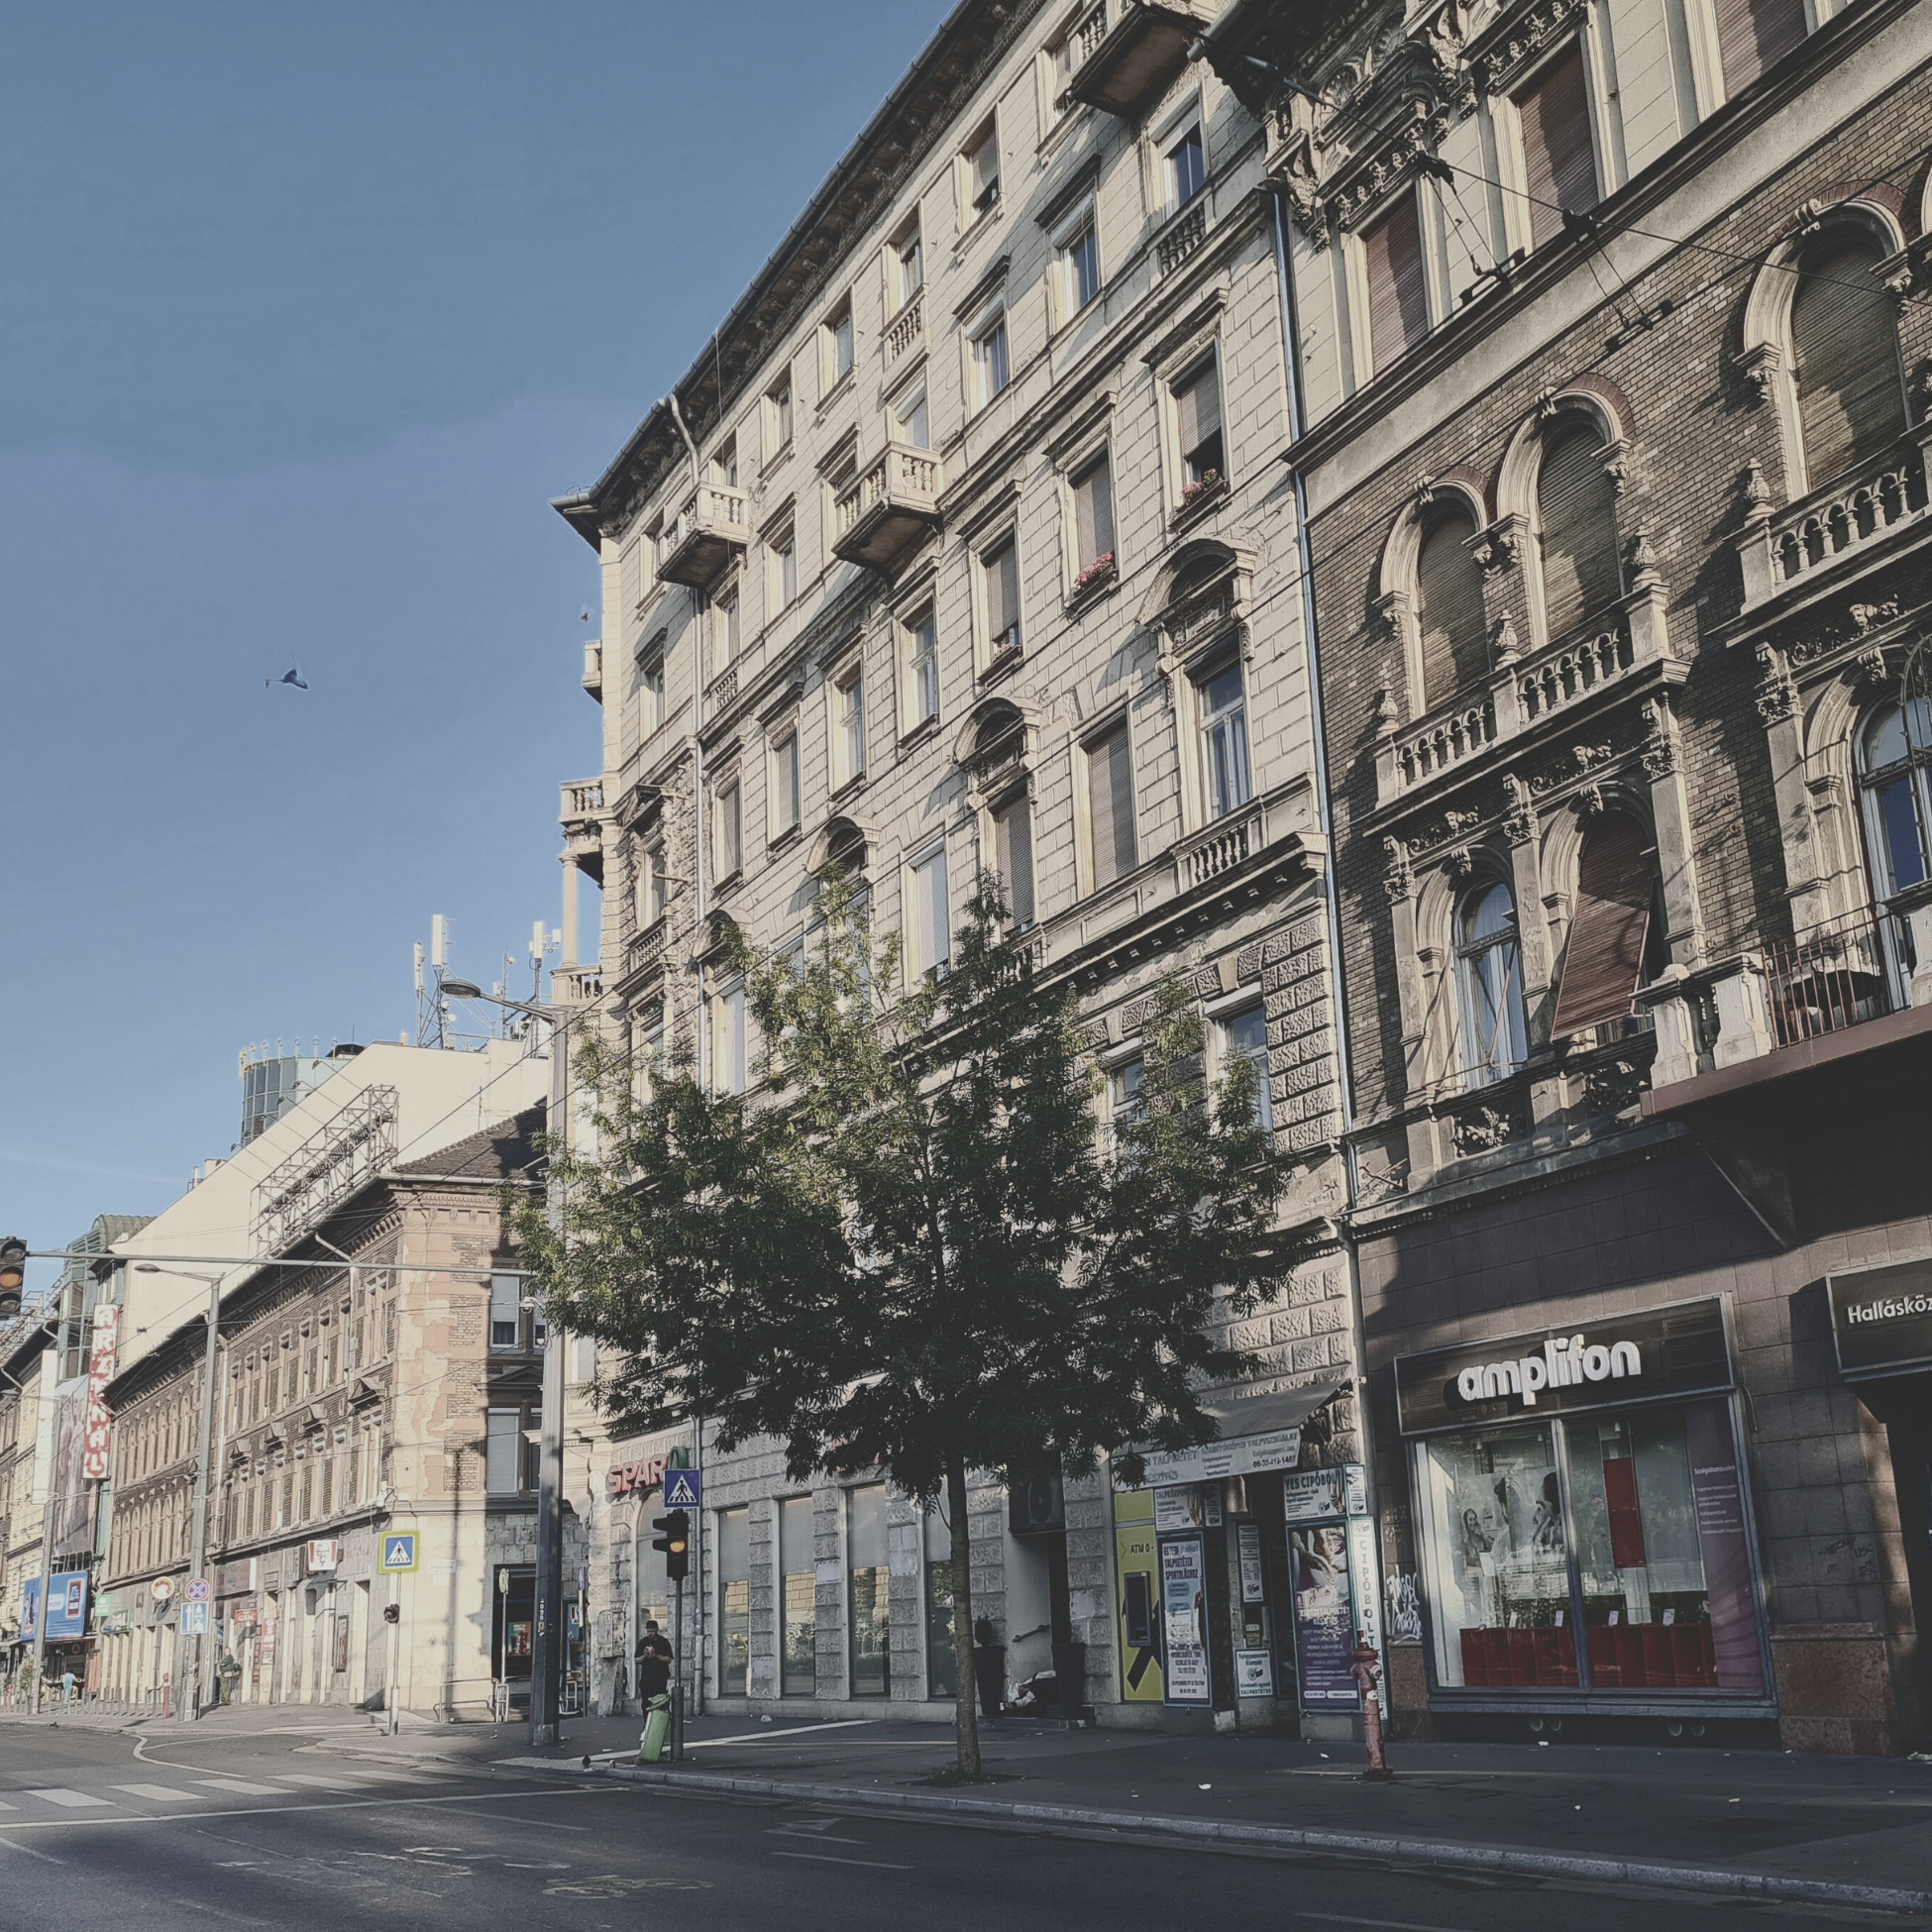
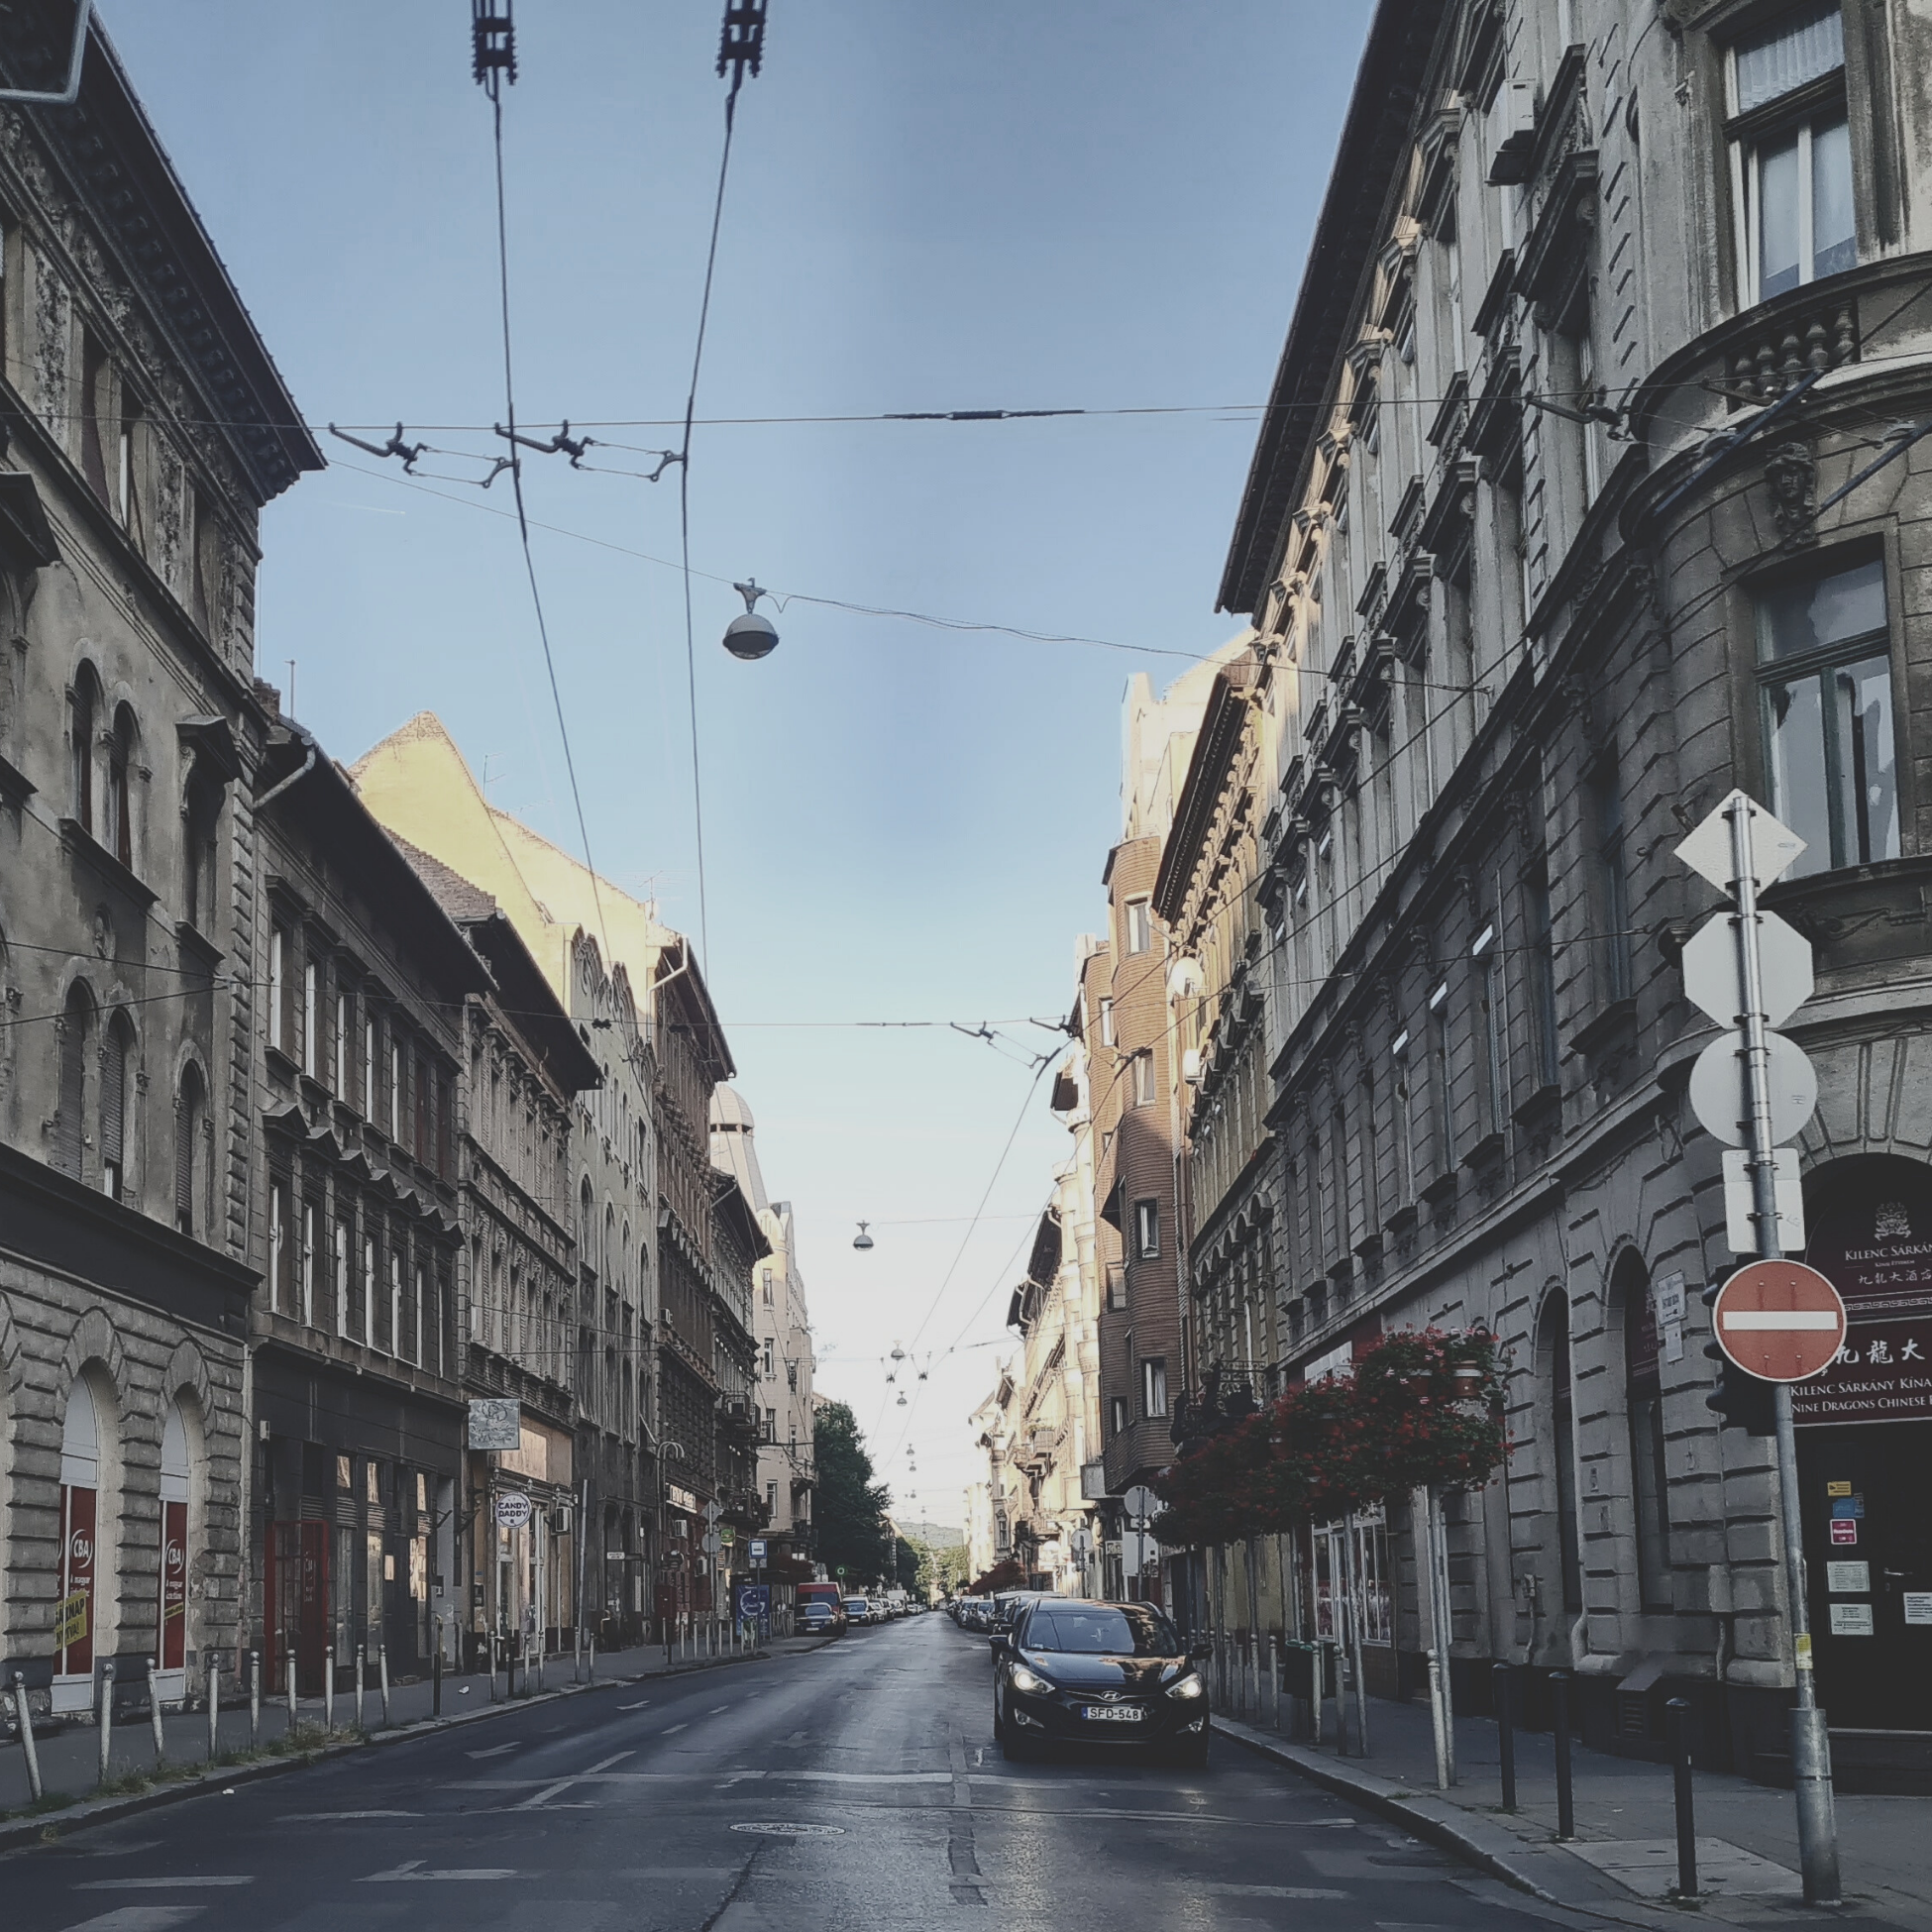
Why does urban heat matter?
Cities are often several degrees warmer than the countryside around them. This extra heat means that:
- electricity supplies are under pressure
- air quality worsens
- heatwaves are more intense, especially for older people and children The hot spots are not spread evenly. One street might have baking pavements, roasting walls and cooler, shady corners only a few metres apart.
CityZcanHub helps us see this hidden pattern. Small, wearable sensor boxes record the temperature and humidity where people walk.
About
CitiZcanHub
With street-level heat measurements playing an increasingly key role in tackling urban heat, the CityZcan sensor box was developed to provide high-resolution data directly from the pavement. The CityZcan Hub turns urban heat research into a modular, sensor-rich platform operating right at street level. By combining high-resolution thermal imaging with air-quality probes and structured community involvement, the system captures the fine spatial and temporal patterns that cause the Urban Heat Island (UHI) effect, explaining why cities are much warmer than their surroundings, particularly at night. These multilayer data streams feed directly into adaptation and climate service workflows, supporting the development of evidence-based strategies for urban adaptation, climate services and gamification. Explore how the platform works and discover its practical applications for understanding and mitigating rising urban temperatures.
About drone sensing
Drone mapping is redefining how we detect, analyse, and tackle the urban-heat challenge. Drone-borne thermal imaging can now provide centimetre-scale, radiometrically calibrated images of Budapest’s urban heat landscape. Flying at an altitude of 350 metres just after sunset, two DJI drones captured 824 infrared and 434 RGB frames, which were later stitched into georeferenced 16-bit and 32-bit GeoTIFF mosaics covering the full extents of Terézváros and Erzsébetváros. These maps reveal residual hot spots at roof and pavement level, support human comfort analyses and enable the machine-learning detection of hidden thermal anomalies. Explore the orthomosaics in the Maps menu and download the raw sensor packages and processing notebooks from the APPs.
What can thermography be used for?
For displaying temperature distribution, troubleshooting, building diagnostics, industrial control, medical examinations, or even environmental monitoring purposes.
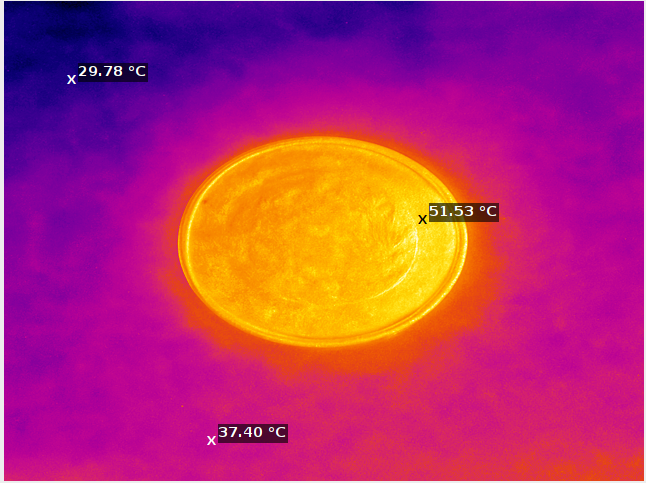
How does thermography work?
All objects emit IR radiation. The thermal imaging system detects this and calculates the surface temperature of the object from the intensity of the radiation, then displays it visually.
What is a heat map?
A visual representation that uses colours or shades of grey to show the temperature of different parts of an object.
What does emissivity (ε) mean?
Emissivity indicates how effectively a surface radiates heat. Its value ranges between 0 and 1. The emissivity of a black body is 1, while that of an ideal white body is 0 (the latter exists only in theory).
Why is it important to know emissivity?
For accurate temperature measurement, the emissivity of the object must be known, otherwise the calculation may be inaccurate.
How is temperature calculated from IR radiation?
According to Stefan–Boltzmann’s law: the energy emitted is proportional to the fourth power of the temperature (T⁴). Knowing the measured radiation and emissivity, the temperature can be calculated.
What types of thermal sensors are there?
- Pyroelectric sensors: generate an electrical charge in response to changes in IR radiation.
- Thermoelectric sensors: utilise the Seebeck effect to generate voltage in response to temperature differences.
- Bolometers: the resistance of the sensor changes in response to IR radiation.
What is a bolometer and how does it work?
A bolometer is a sensor whose electrical resistance changes in response to temperature changes. It heats up when exposed to IR radiation and generates an electrical signal from the resulting change in resistance, which is processed and displayed as an image.
What materials are bolometers made of?
Vanadium oxide (VOx) or amorphous silicon (a-Si) are often used because they react sensitively to IR radiation.
What are the most well-known ballistic sensors?
- FLIR Lepton 3.5 – VOx-based bolometer, compact and accurate.
- Seek Thermal – InspectionCAM IQ-AAA – VOx technology.
- Terabee Evo Thermal 90 – thermoelectric solution.
- Omron D6T – MEMS-based thermoelectric sensor.
Visualize the heat
Heat maps
A heat map is a “thermograph” of a city – an image that shows surface temperatures in different colors. Unlike traditional air temperature measurements, it shows where heat is actually accumulating: sunny roofs glow yellow and red, shady parks appear cool blue, and all the shades in between are also visible. By transforming invisible heat into a clear image, heat maps can be used to determine where reflective coatings, shade trees, or cool roofs are needed, instead of guessing.
Discover Budapest’s new urban heat portal and see for yourself how Terézváros and Erzsébetváros heat up – and, more importantly, how they could be cooled down.
Heat map analysis sripts
This Python script turns paired thermal- and RGB orthophotos into temperature maps for roofs and streets, then clusters each surface by colour/material to deliver clear statistics and ready-made graphs for Urban Heat Island studies. The script first loads four inputs: a standard RGB orthomosaic, its matching thermal mosaic, a mask that marks buildings and streets, and a colour bar that links each palette colour to a real temperature. It corrects brightness and, if requested, removes roof shadows. Every pixel in the thermal image is then converted to an exact temperature and saved for quick reuse. Using K-Means clustering, the code groups roof and street pixels into material-colour classes. For each class it calculates the minimum, maximum, average, median and standard-deviation temperatures, and it produces PNG charts that show the temperature spread and the area each class covers.

CitiZcanView
Turn raw thermal pixels into climate insight. CityZcanView is an open-source plugin for the Fiji image-processing platform that opens .tiff files from Lepton 3.5 sensors, displays real-time temperature read-outs, and lets you save colour-scaled, annotated PNGs in a click. Designed for urban–heat-island studies and environmental monitoring, the add-on puts scientific-grade image analysis in the hands of planners, researchers and citizen scientists alike.
Uncovering Budapest’s urban heat: What can we learn?
Data stories

Game
“Thermaform Your City,”
It is a cooperative, card-based serious game, brings these challenges to life by simulating urban heat island events. Players assume roles that require them to mitigate temperature rises and allocate resources for cooling, directly mirroring the real-world scenarios informed by data collected in the LL. By doing so, the game seeks to raise public awareness, highlighting the severity of heat stress and the trade-offs between cost, temperature reduction, social stability, and infrastructural investment.

Call to action
About the I-CISK project
The I-CISK (Inclusive Climate-smart Knowledge-into-action Services) project tackles the rising need for human-centred climate services. Instead of delivering one-way forecasts, the EU-funded consortium co-designs “next-generation” climate services with local users so that data, social insights and behavioural aspects are woven together. By embedding seven Living Labs across climate-change hotspots in Europe and Africa, the project fast-tracks actionable knowledge for sectors such as water-scarce agriculture, forestry, livestock and urban planning. Each lab iteratively tests new digital tools, socio-environmental models and decision dashboards so that farmers, municipal planners and other stakeholders can translate complex climate information into day-to-day, climate-smart decisions.