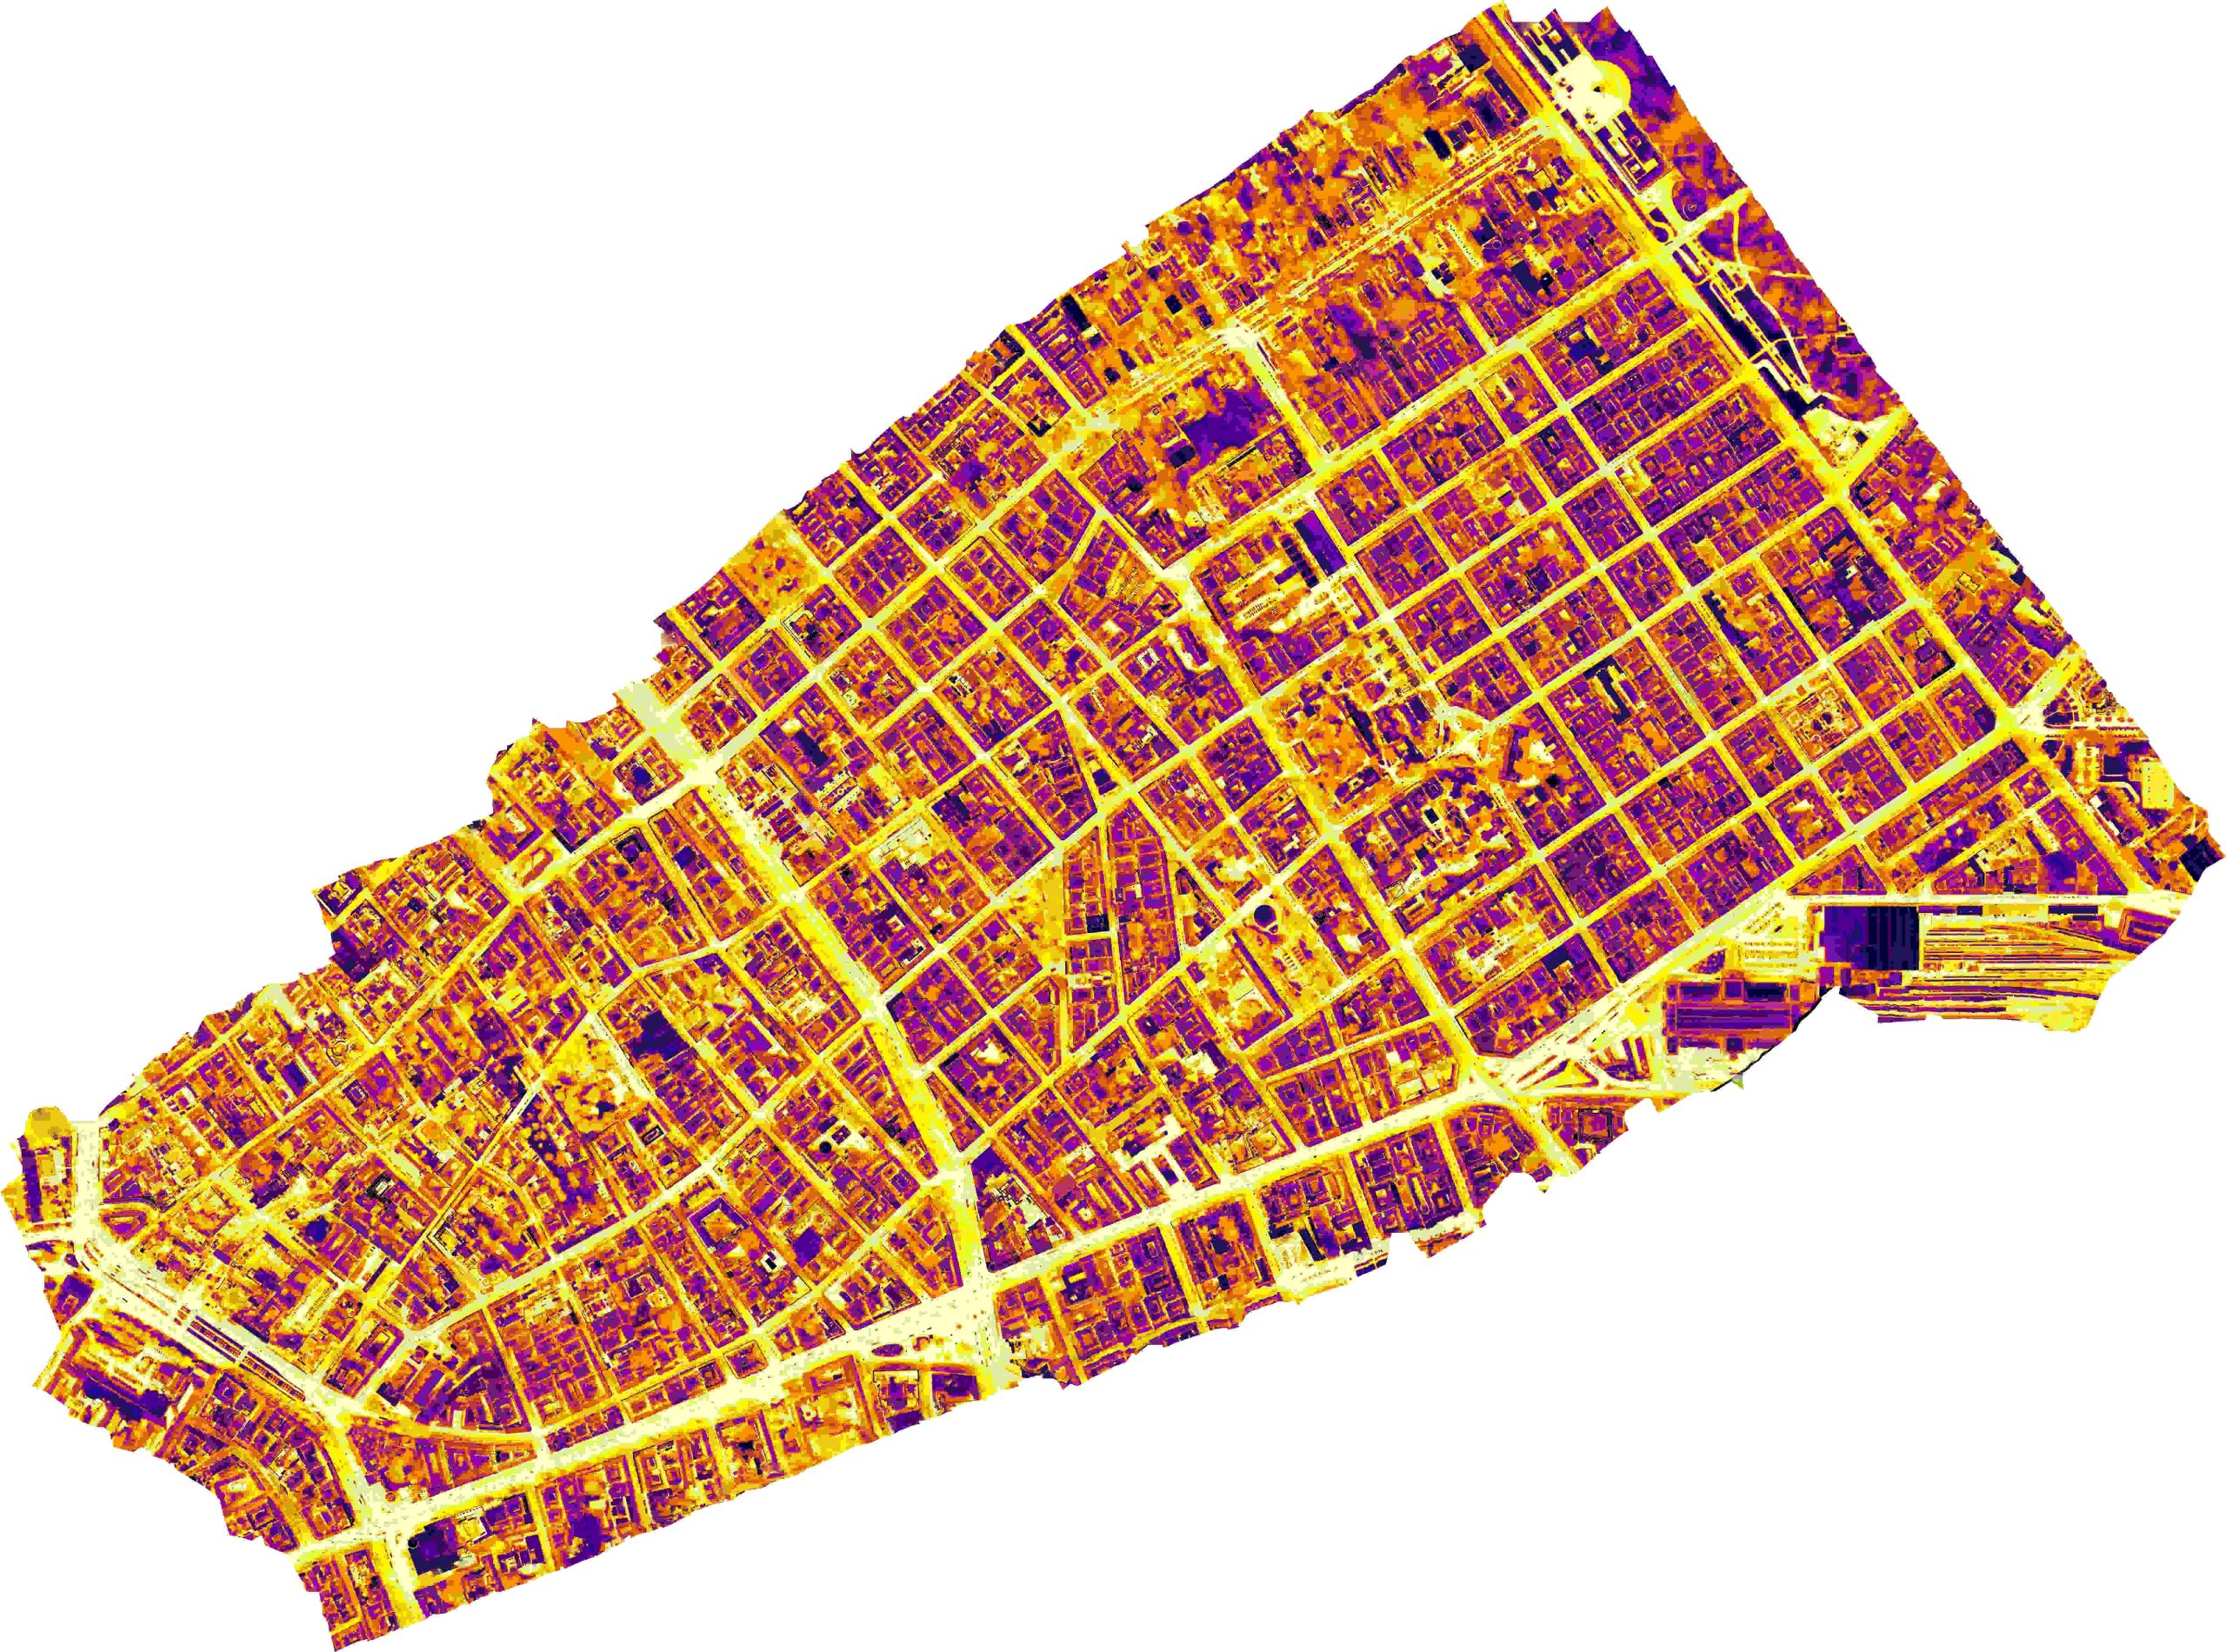
In 2023, a comprehensive thermal camera study was conducted in Budapest to analyze how various urban elements contribute to the city’s heat. Using a Flir One camera attached to a mobile phone, we captured detailed thermal images to identify significant sources of urban heat and potential cooling solutions. This blog post presents key findings from this study, highlighting the significant sources of urban heat and potential solutions for cooling our city.
The heat impact of air conditioning units
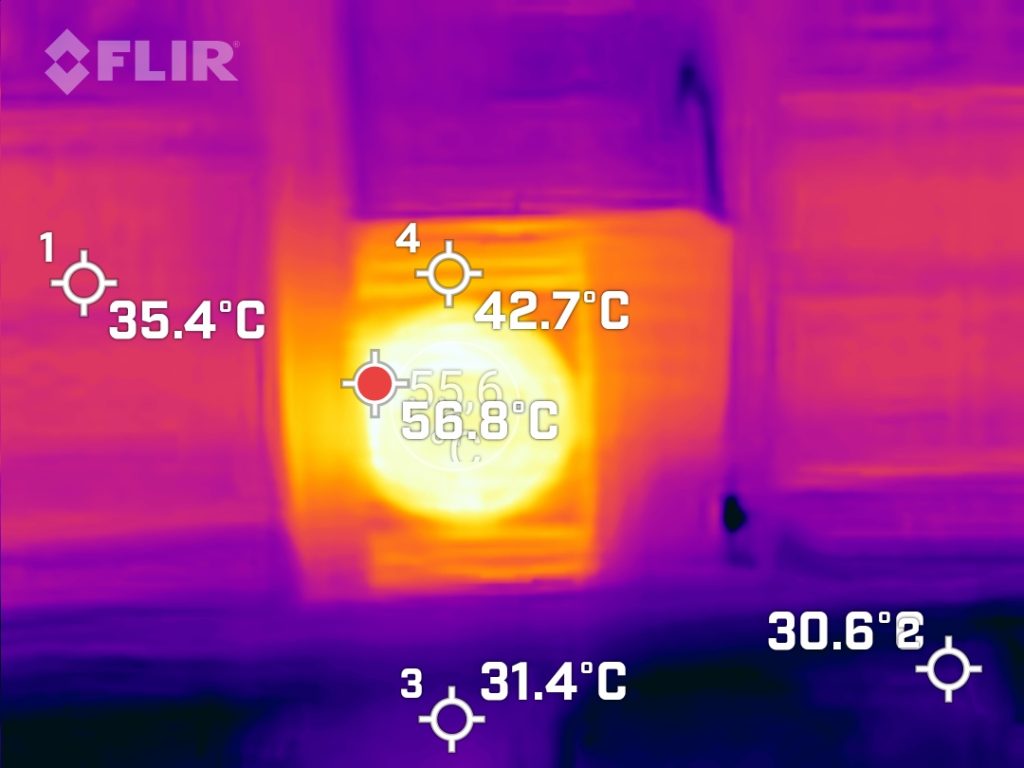
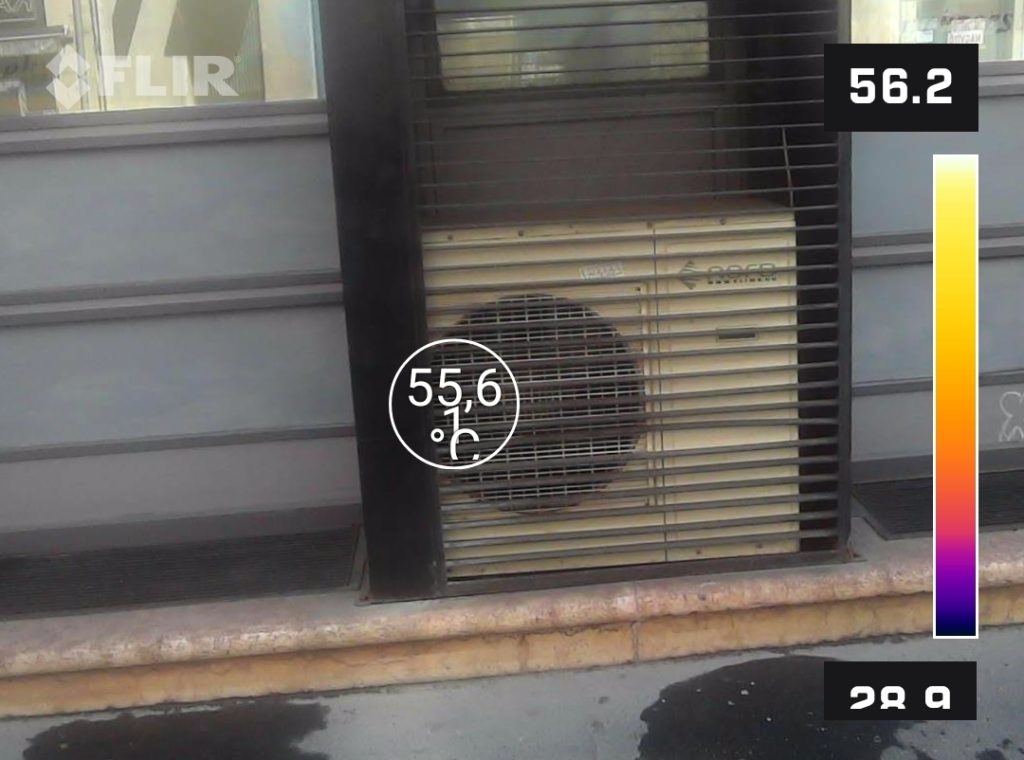
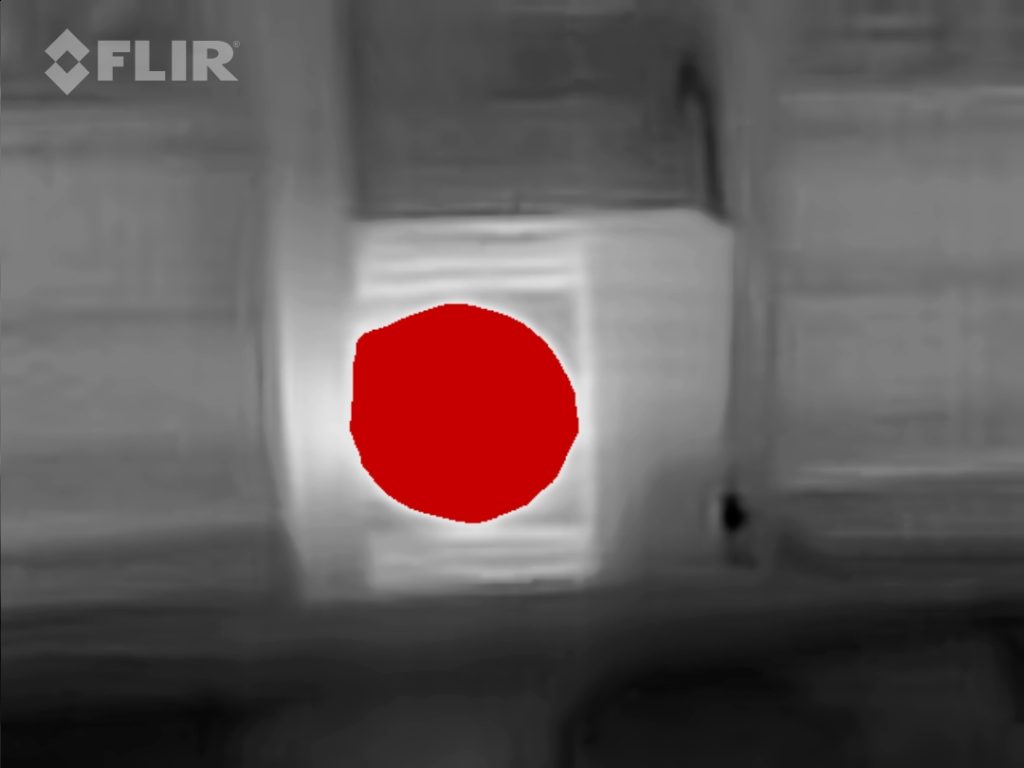
In the heart of Budapest, in Erzsébet- and Terézváros, it’s really hot in the summer. The thermal images show that the outdoor units of spot air conditioners on the street-facing sides of buildings are releasing a lot of heat into the urban environment.
The thermal camera measurements show that the air conditioning unit is a source of heat, with temperatures reaching up to 56.8°C. The surrounding areas are cooler, but still have elevated temperatures of 35.4°C and 42.7°C, which are significantly higher than the ambient air temperature. This shows that the heat given off by the unit affects the area around it and contributes to the wider urban heat island effect.
If these units are placed at street level, they can cause heat stress for people walking past. The hot air creates a localised hotspot, which makes it uncomfortable for anyone walking near them. This is a real issue in densely built urban areas like Erzsébetváros, where space is limited and air conditioning units are often installed close to pavements.
In the context of extreme heat, there are several alternatives to individual air conditioners that can help mitigate the environmental impact while providing effective cooling.
- Passive cooling is all about using design and architectural techniques to keep indoor temperatures down without relying on mechanical systems. Some great ways to keep cool are to let in the fresh air at night and use blinds or shades during the day. Studies have shown that these methods can lower indoor temperatures by up to 14°C and reduce the load on air conditioners by up to 80%.
- Plants on roofs and walls can help keep buildings cool by reducing surface temperatures and providing natural insulation, which means you might not need to use as much mechanical cooling.
- Making sure buildings are well-insulated and sealed can stop heat getting in, so you don’t need to rely on air conditioning as much.
- District cooling is a way of cooling multiple buildings from one central location. The cooled water is sent through insulated underground pipes, and this method has several benefits. District cooling systems can save up to 50% on energy and emissions compared to traditional air conditioners because they can make use of economies of scale and the diversity in cooling demand.
Cooling effect of an urban parklet
How does a parklet in the city keep cool?
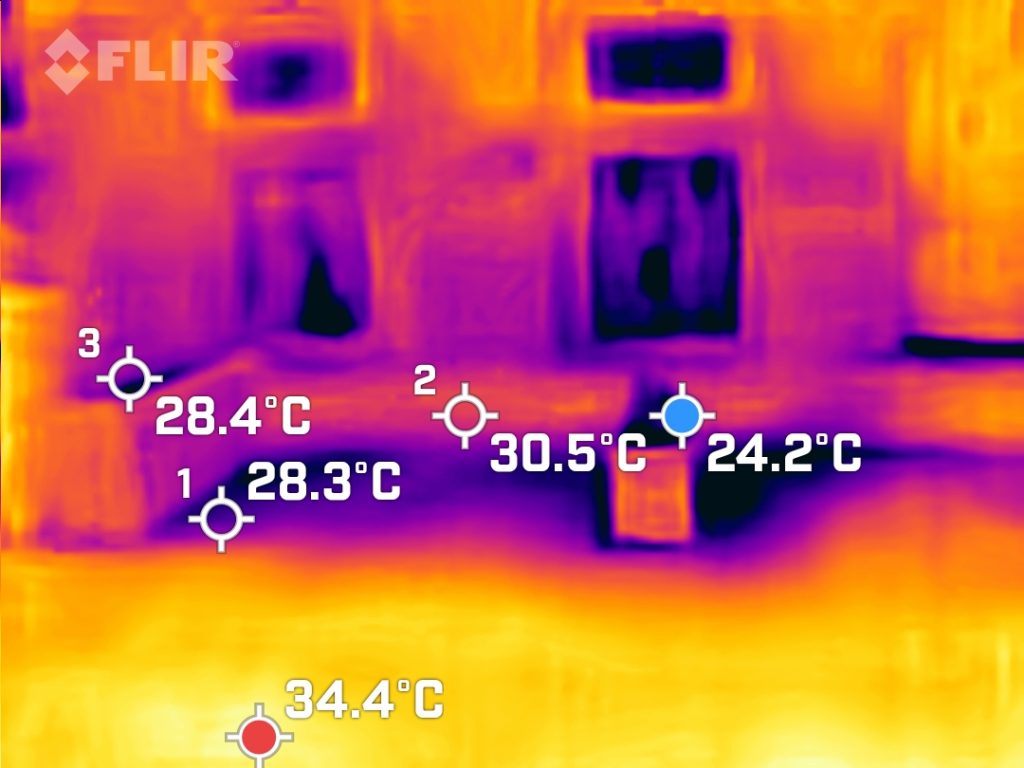
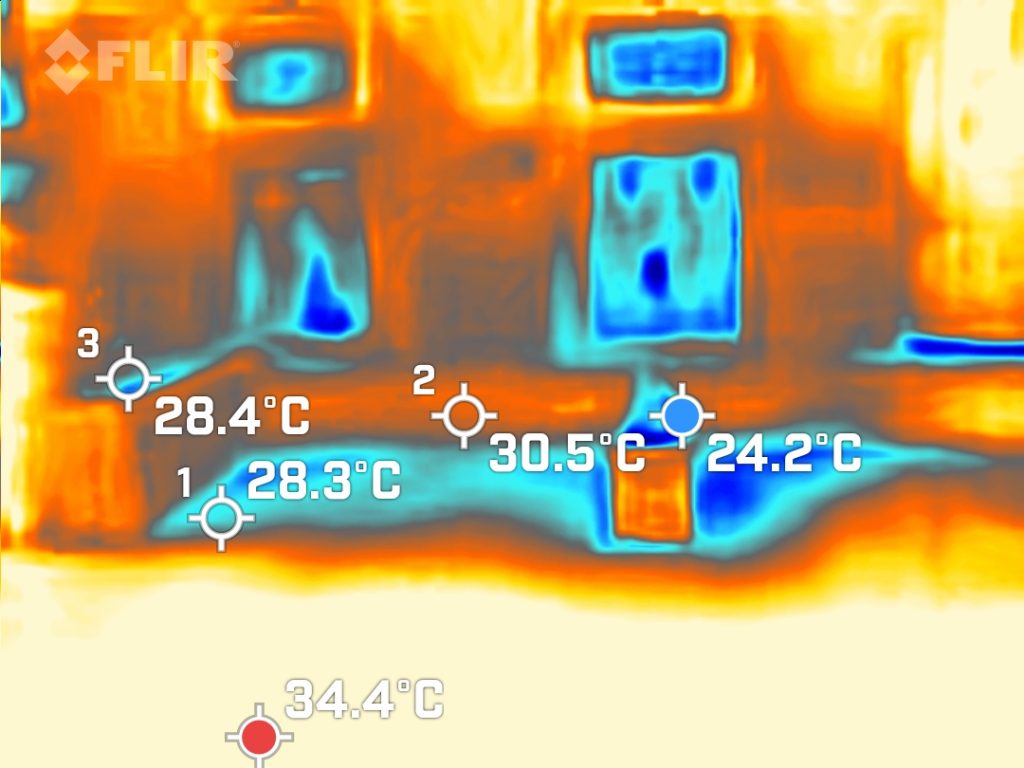
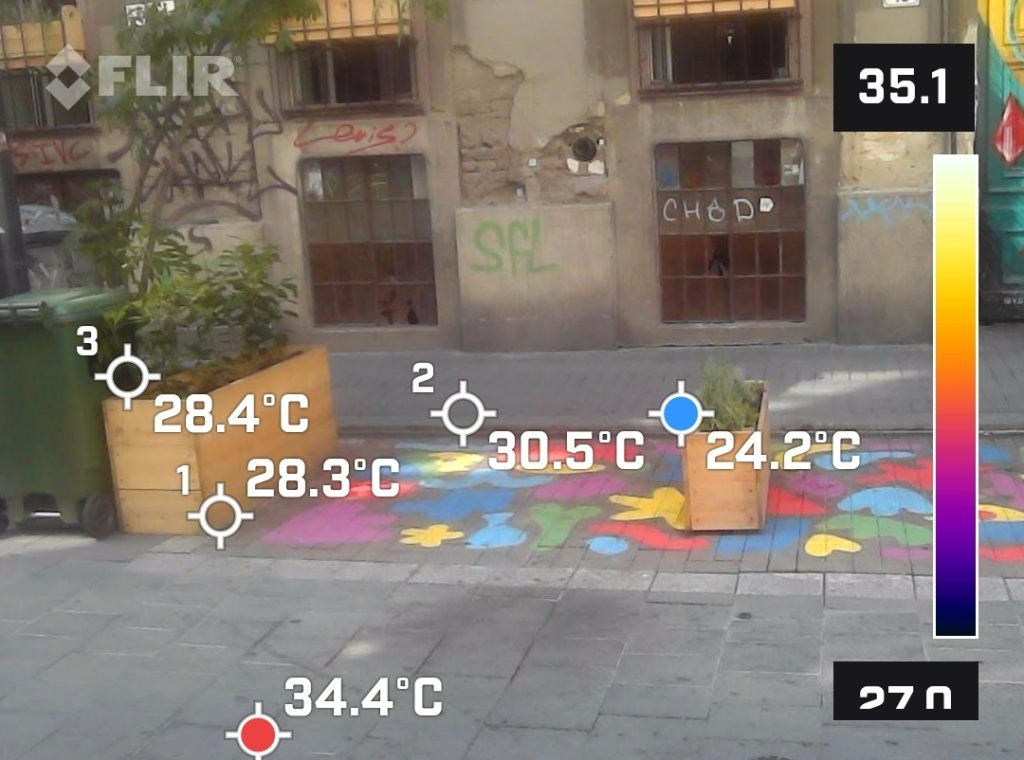
In Budapest, the summer heat is intense. The images above show how a flower pot or parklet can affect the heat output of surfaces. The images show a pavement decorated with colourful shapes and flower pots, and a bare, stone pavement. The measurements were taken in the shade during a hot and suny day.
The surrounding stone pavement heated up to 34.4°C, whereas the areas with flower pots and coloured pavement showed cooler temperatures, with 24.2 to 28.4°C measured next to the flower/green pot and 30.5°C measured on the coloured pavement.
Although a single flower pot or a small patch of coloured pavement will not drastically reduce the overall heat output of a street, they can create slightly cooler zones. Placing several of these facilities in an urban area can make the atmosphere more pleasant and cooler, which improves quality of life for city dwellers.
These plots also promote natural cooling through evaporation. The use of reflective or light-coloured materials in paving pavements can further enhance the cooling effect, as these materials absorb less heat than traditional dark asphalt.
Cooling effect of open gates
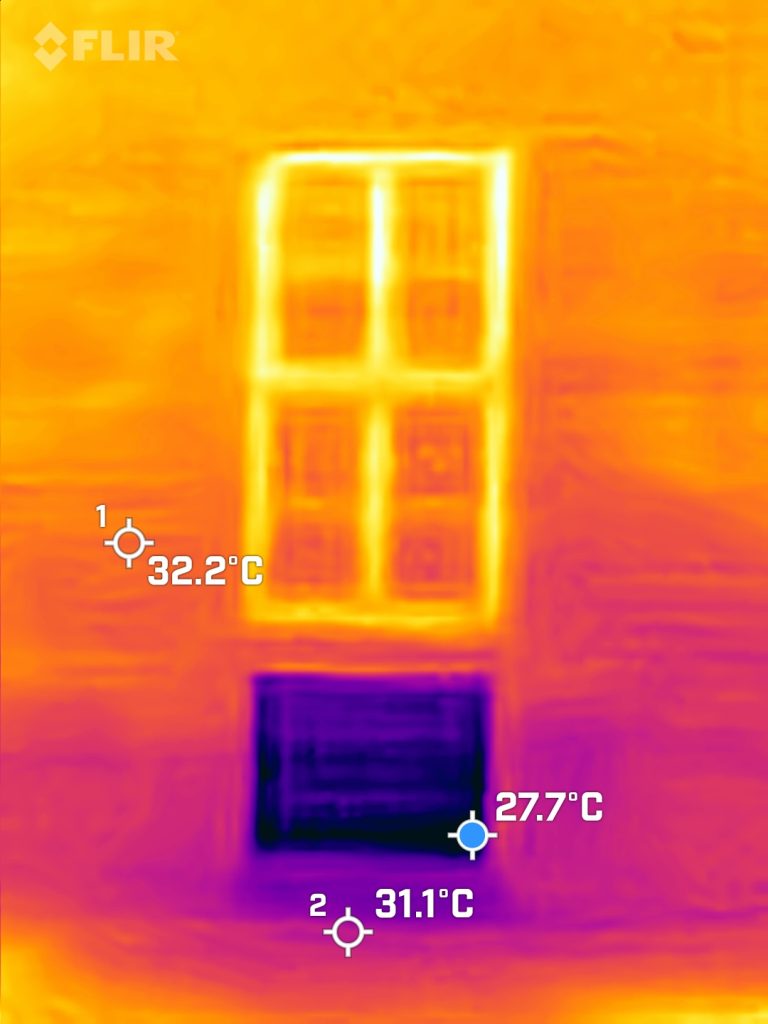
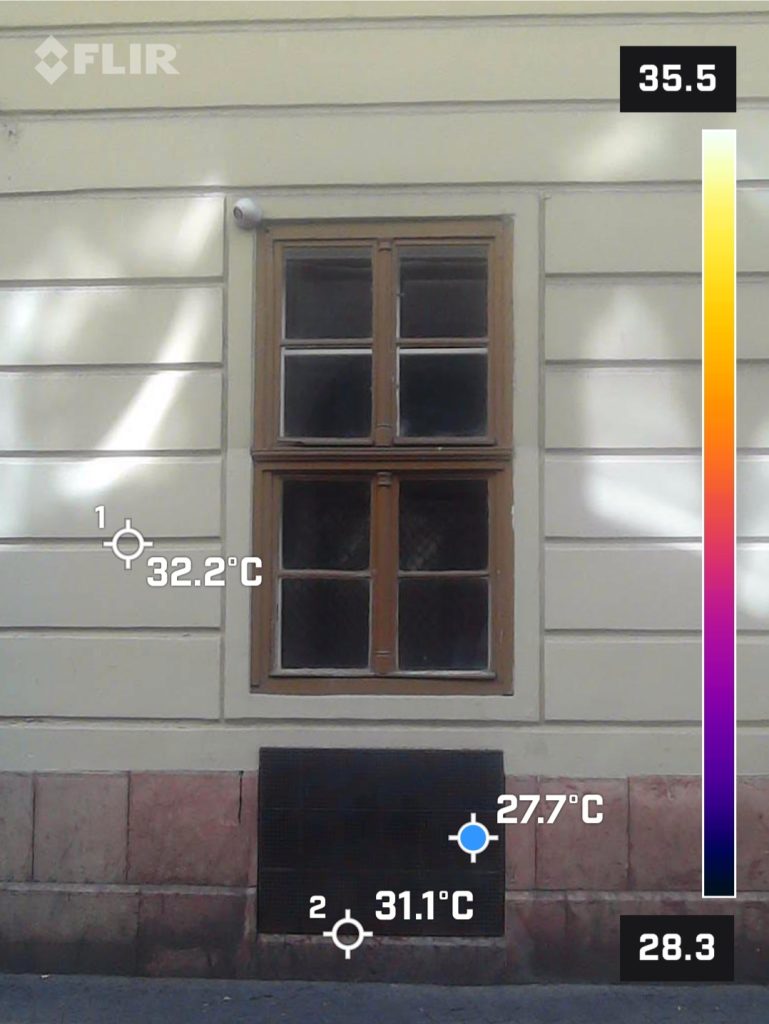
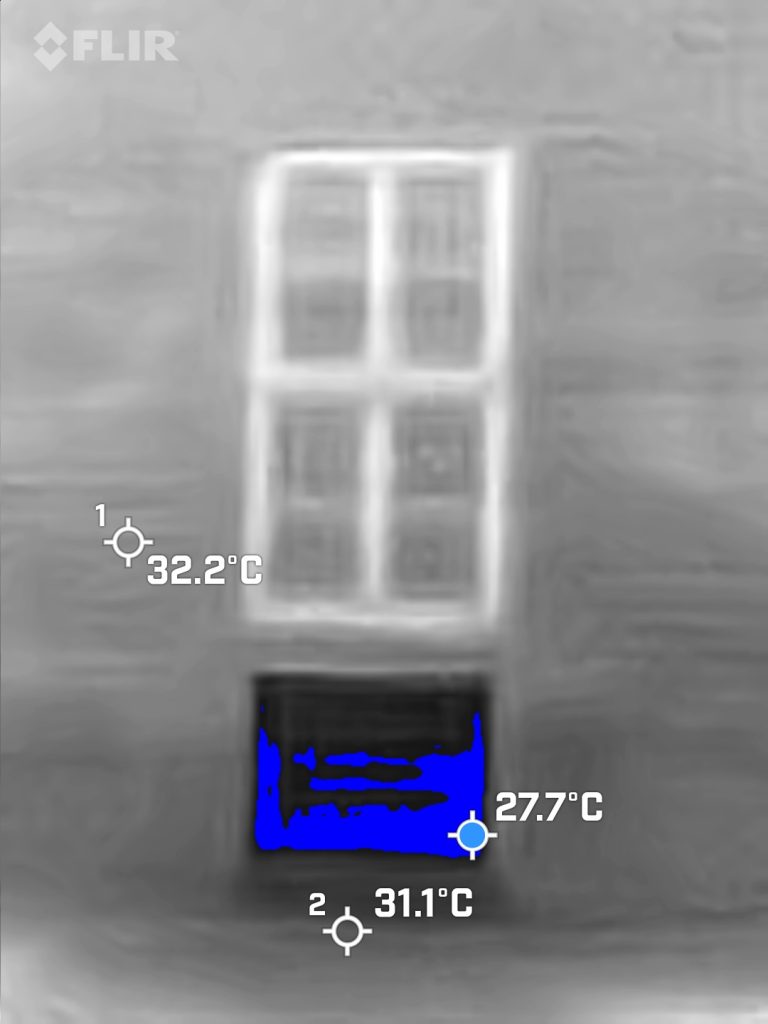
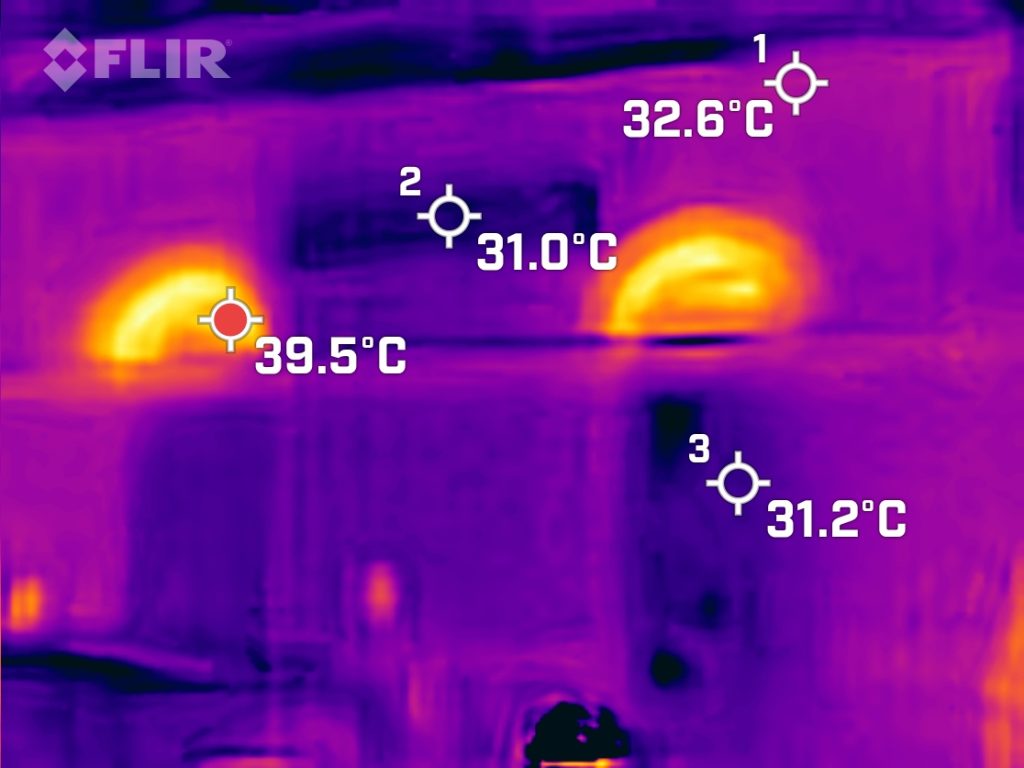
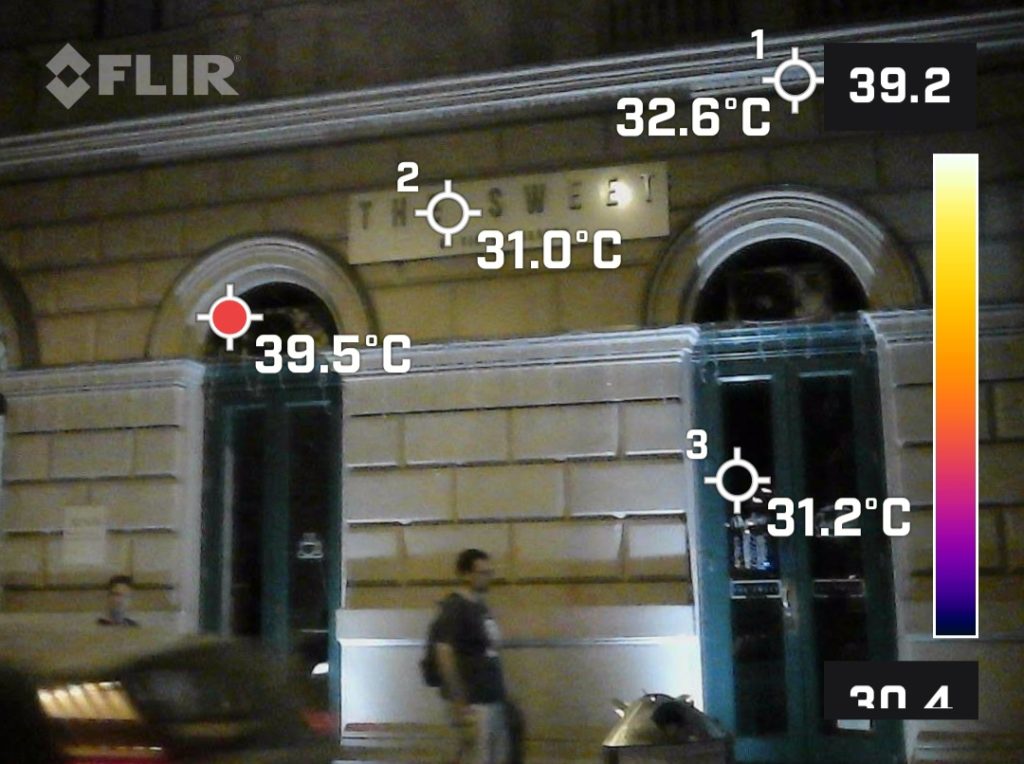
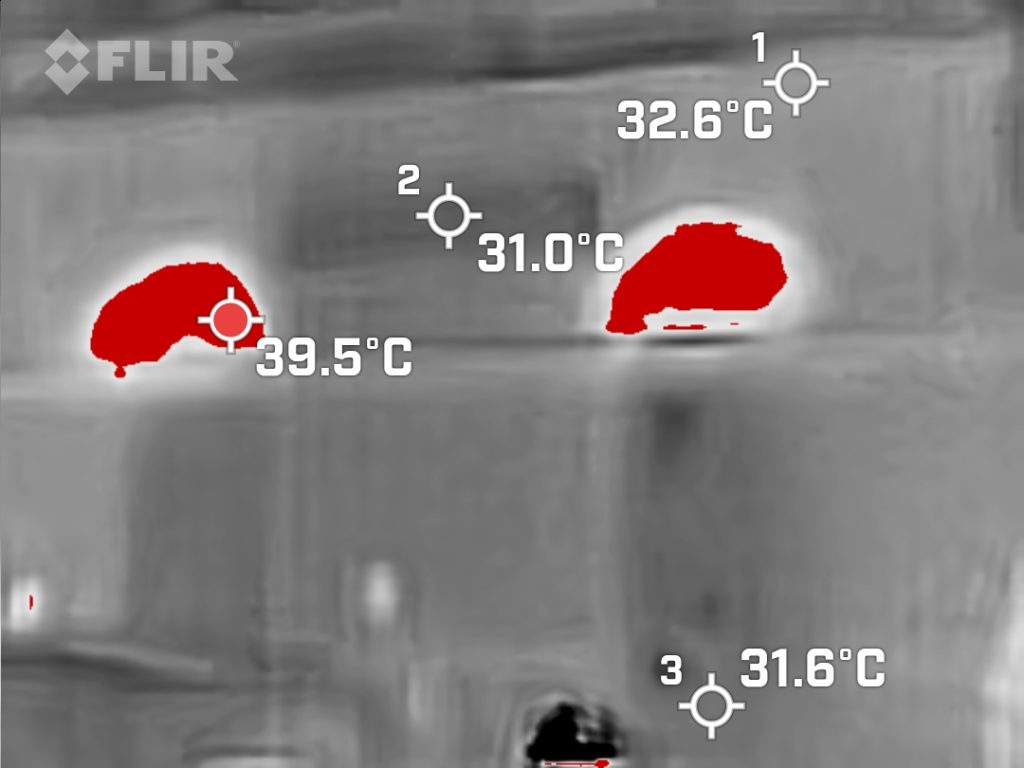
Natural ventilation can play an important role in reducing the high temperatures at streets. The thermal images above show a phenomenon: cooler air flows out of an open basement and inner courtyard of a block of flats, cooling the surrounding area.
The thermal camera records the temperature differences between the building and the areas around the open window of a cellar, allowing cooler air to flow out of these spaces and replace the hot air outside. Temperature measurements show that the temperature around the open basement window is only 27.7°C, while the temperature of the surrounding walls exceeds 32.2°C. This cooler air promotes natural ventilation and air circulation at street level, creating a more comfortable microclimate.
Natural ventilation through open windows/open gates can reduce the urban heat island effect. In addition, the incorporation of green infrastructure such as trees, green roofs and living walls further contributes to cooling by providing shade and promoting evaporative cooling.
This method can be a particularly important tool in densely built-up urban areas such as Erzsébetváros or Terézváros.
The effects of watering on heated pavement
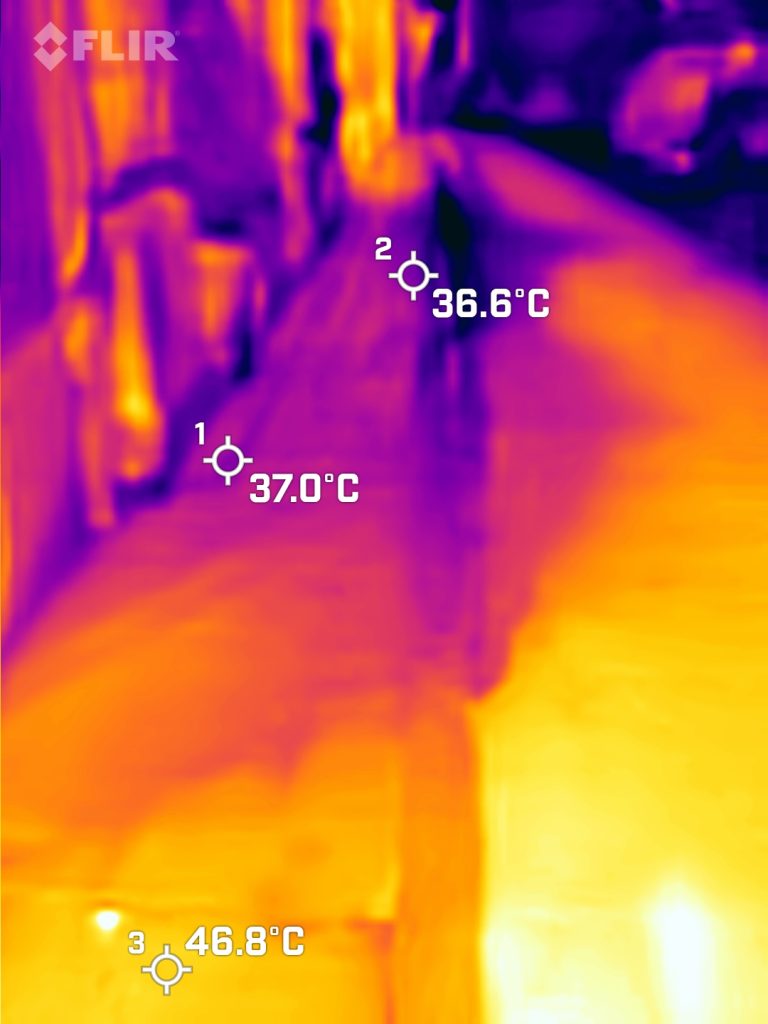
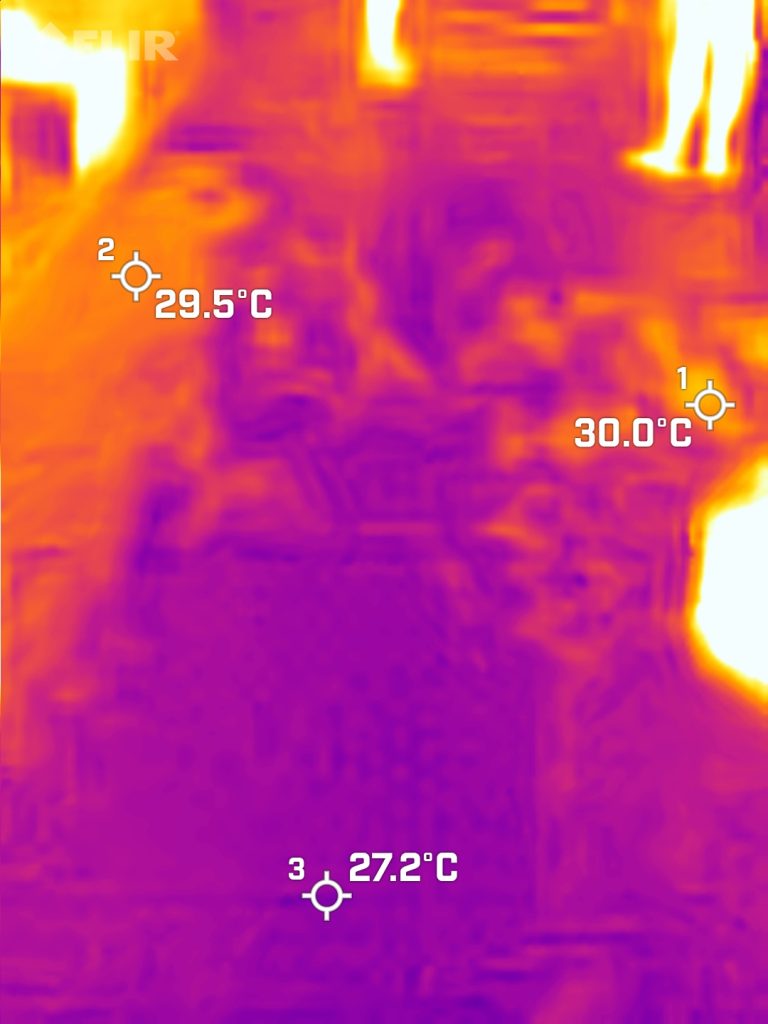
Pavements can get pretty toasty in the Budapest summer sun. Some residents and businesses use water spray to keep cool. But is this really effective, and is there a better way to do it? We did some thermal imaging measurements in Erzsébetváros during the day on a really hot day.
The images show the temperature of pavements that have been sprinkled and those that haven’t.
The thermal images revealed that the pavement was significantly cooler after watering. In the areas that weren’t sprayed with water, the pavement temperature ranged from 46.8 °C
The thermal images show that the watered pavement is about 10 degrees colder.
After watering, the pavement cools down quickly, but the effect is not permanent. As the water evaporates, the pavement warms up again. So in the long term, this will not solve the problem of an overheated street. Other measures, such as shading or using light-coloured pavements and planting plants, may be more effective.
The heat of urban benches
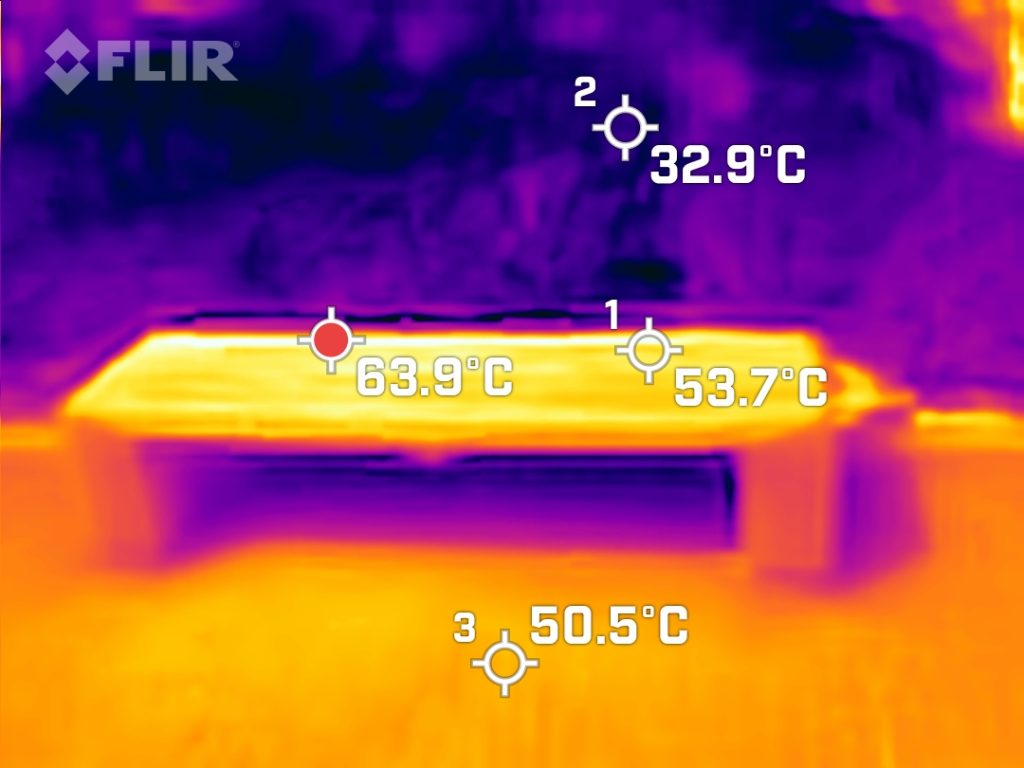
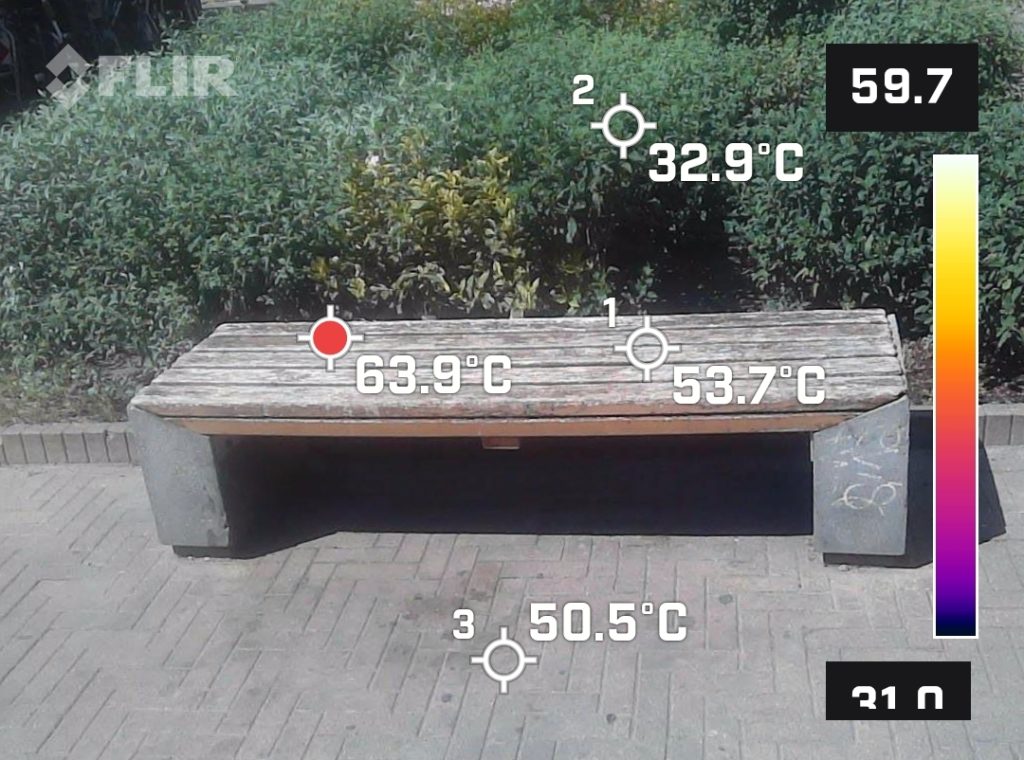
A bench exposed to direct sunlight has become dangerously hot. Despite being made of wood and surrounded by green vegetation, the thermal camera shows that the surface of the bench can reach temperatures of up to 63.9°C. Even the cooler parts of the bench have warmed up considerably, with readings of 53.7°C and 50.5°C.
Urban objects such as benches, pavements and building surfaces absorb and radiate heat, contributing to the overall heat stress experienced by city inhabitants. Vehicles, air conditioners and other machinery all emit heat, further increasing urban temperatures.
During heat waves, the availability of cool and shaded places to rest is essential for the health and comfort of the public. The thermal images highlight a critical aspect of summer urban life: the need for thoughtful planning and design to reduce heat. While benches and other urban furniture are essential to improve well-being, their shading and materials need to be carefully considered to avoid becoming a source of discomfort.
The heat of parked cars
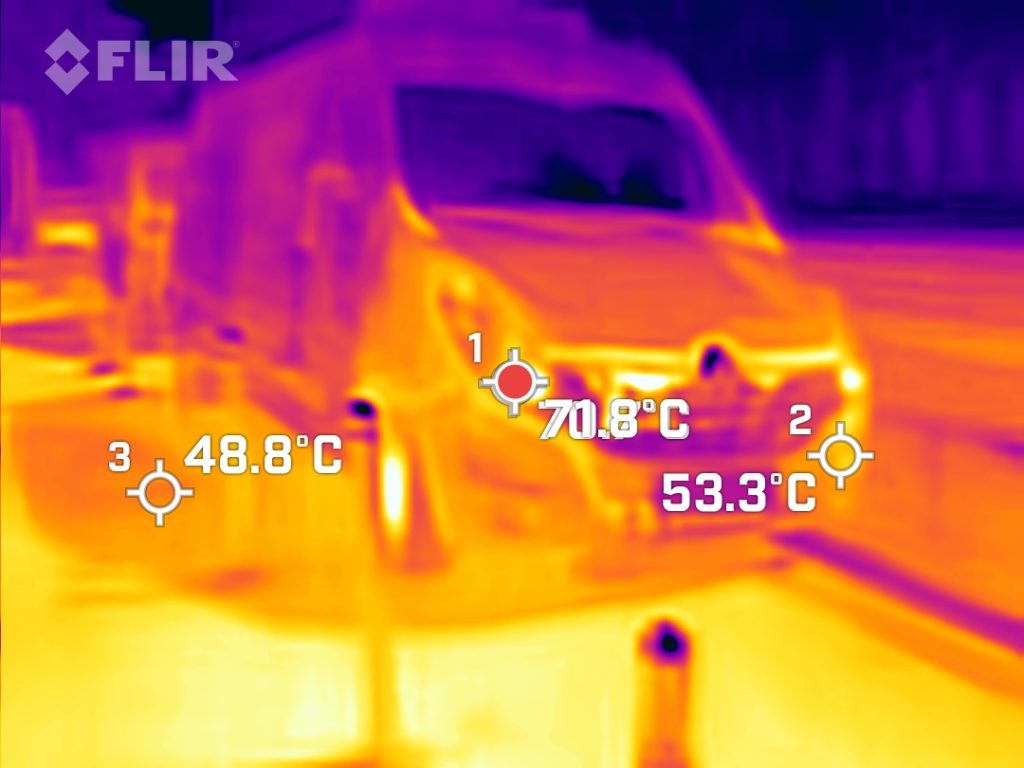
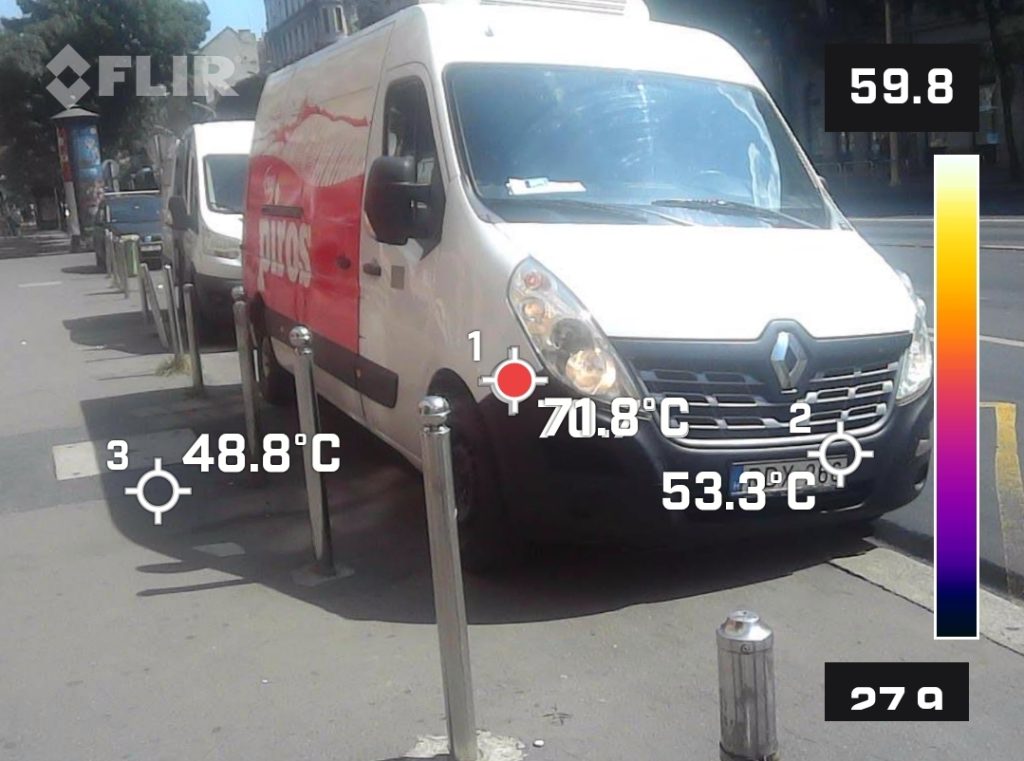
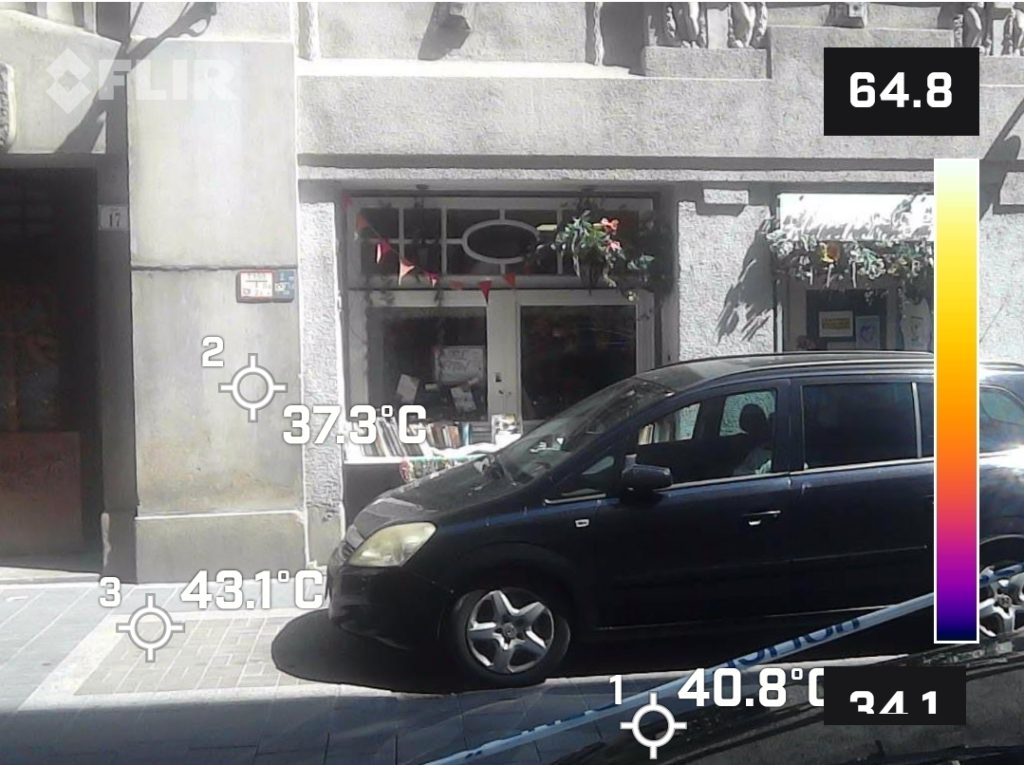
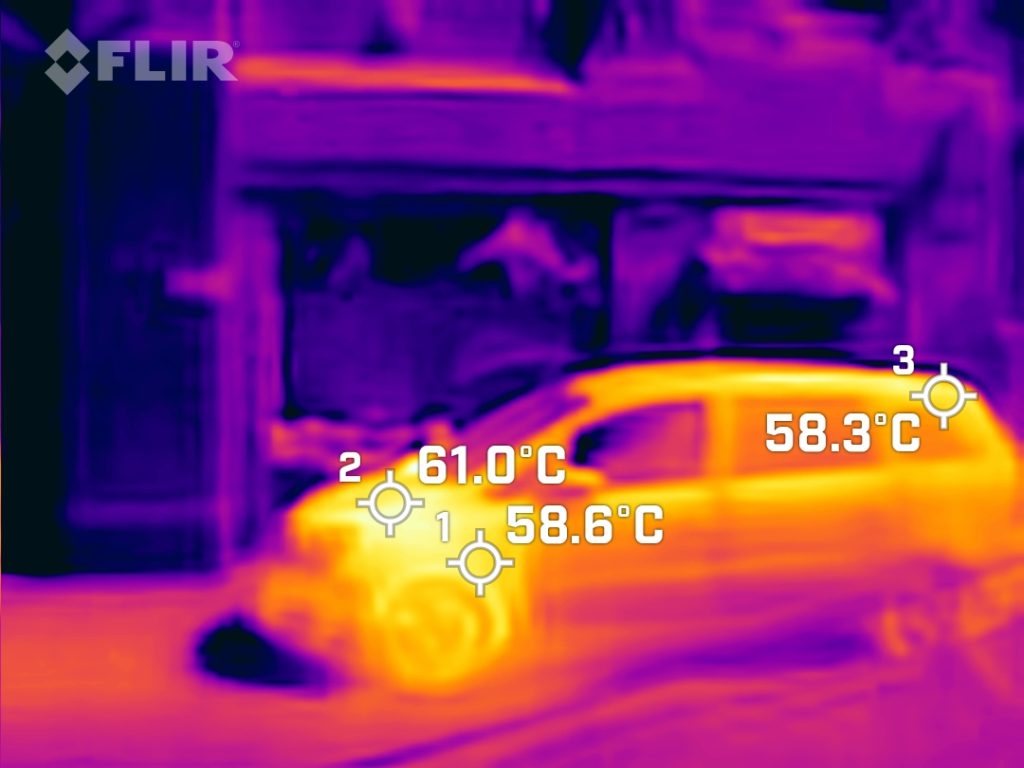
The thermal images above show an important but often overlooked source of urban heat: parked cars. The thermal camera captured a parked car and truck radiating large amounts of heat onto the pavement. The car’s specific temperature readings show alarming data: the car’s body reaches 61.0°C, while the rest of the car measures 58.6°C and 58.3°C respectively. The body of the van is around 71 degrees Celsius.
These high temperatures indicate that parked cars become powerful heat sources, significantly affecting the thermal comfort of pedestrians passing by. The problem is exacerbated when cars are parked or when drivers leave their engines running to maintain air conditioning. The latter not only emits more heat, but also contributes to air pollution.
Designating parking areas away from pavements can reduce direct exposure to vehicle-generated heat. At the same time, it is important to encourage drivers to switch off their engines when parking to reduce unnecessary heat emissions and improve air quality.
The heat of walls
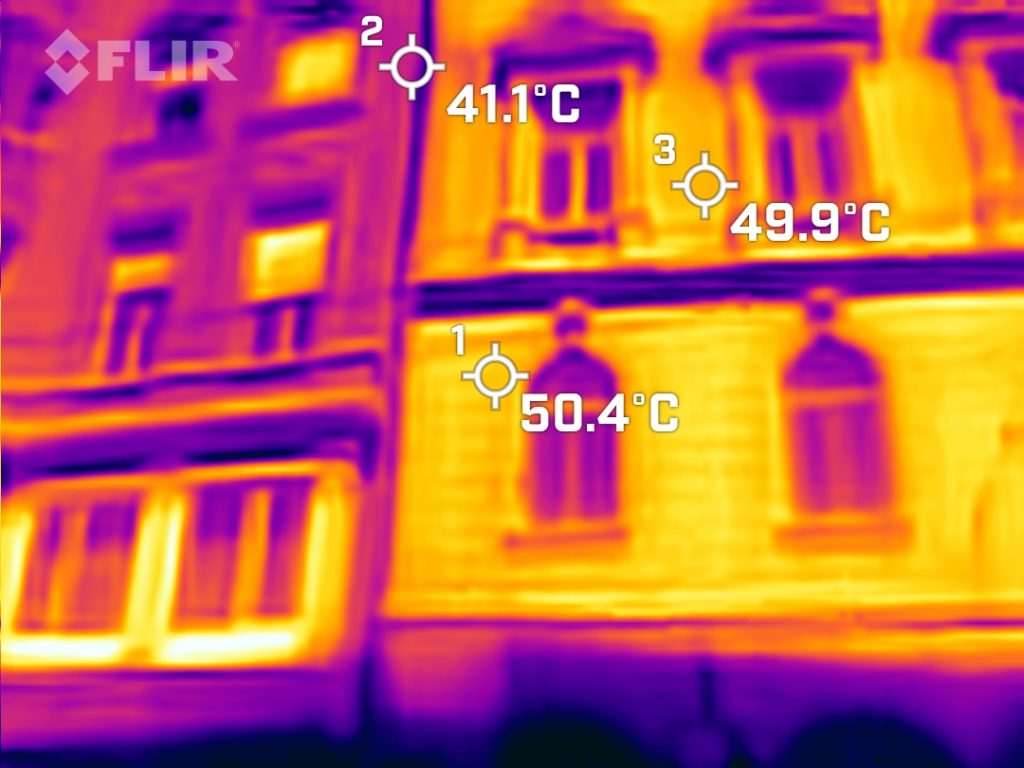
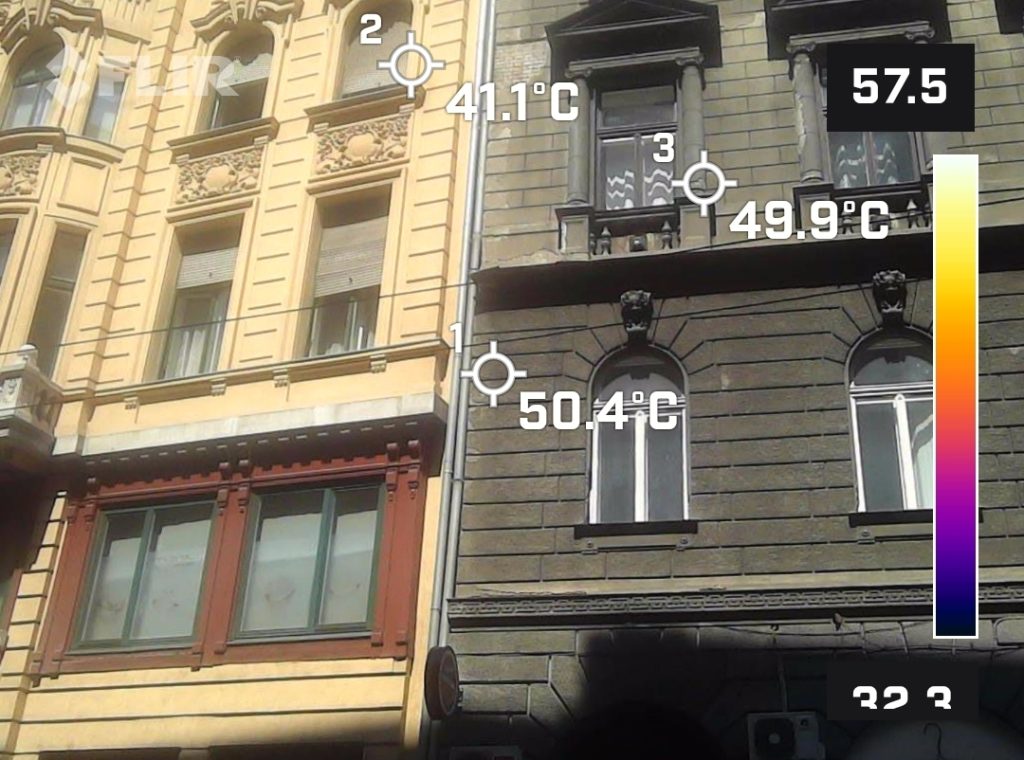
These images clearly demonstrate the significant impact that exterior wall color can have on a building’s thermal performance. The building on the left, with a lighter-colored facade, exhibits a surface temperature of 41.1°C. In contrast, the building on the right, with a darker facade, reaches much higher temperatures of 50.4°C and 49.9°C. This difference in surface temperature is directly related to the ability of the wall colors to absorb or reflect solar radiation. Lighter colors, like the one on the left building, have a higher solar reflectance and thus absorb less heat from the sun.
The material and insulation properties of a building’s facade are also crucial factors in determining its thermal performance. Proper insulation can prevent heat from penetrating the building’s interior, reducing the need for air conditioning and improving overall energy efficiency.
These findings have broader implications for the urban heat island effect, where cities with numerous dark-colored buildings and poor insulation can suffer from significantly higher temperatures compared to surrounding rural areas.
To mitigate the urban heat island effect and improve building energy efficiency, some key strategies include:
- Using light-colored, high-reflectance materials for building facades and roofs
- Incorporating green roofs and walls to increase vegetation and evaporative cooling
- Improving insulation and air sealing to reduce heat transfer through the building envelope
- Planting more trees and increasing urban greenery to provide shading and evaporative cooling