Drones transforming urban thermal mapping
Satellites are great for spotting regional hot spots, but their resolution is rarely fine enough for street-level action. A quadcopter or multirotor carrying an infrared sensor can fly a few hundred meters above the ground, capture centimeter-scale pixels, and return to your desktop before the asphalt cools off.
Drone thermal imaging is a key technology for understanding and monitoring the urban heat island effect. It enables the planning and implementation of effective, location-specific interventions. It allows for mapping fine spatial and temporal heat distributions in urban areas.
Infrared cameras measure heat radiation emitted from surfaces in real time, clearly revealing heat sources such as overheated roofs, pavements and streets that contribute to the heat island effect. The data collected in this way can be used to create detailed heat maps. These maps help to identify critical hotspots, such as overheated buildings or materials, and can inform the planning of urban interventions, such as green roofs, cool roof coatings, and high-albedo pavements.
Drone thermal imaging is fast, non-invasive and cost-effective as it does not require a built-in sensor network, and it can collect data from hundreds or even thousands of measurement points in a single flight.
A drone-based thermal mapping (Budapest case study)
On 14 August 2023 Budapest LL teamed up with the AirScan company to map two adjoining districts in central Budapest.
- Flights:
- In Erzsébetváros: Three back-to-back flights (20:00, 20:45, 21:15) kept below the 22:00 curfew yet captured the full decay phase of the day’s heat load.
- In Terézváros: Two separate flights (20:09 – 21:41) captured the district in both visible and thermal wavelengths, creating a complete, night-time snapshot of its residual heat.
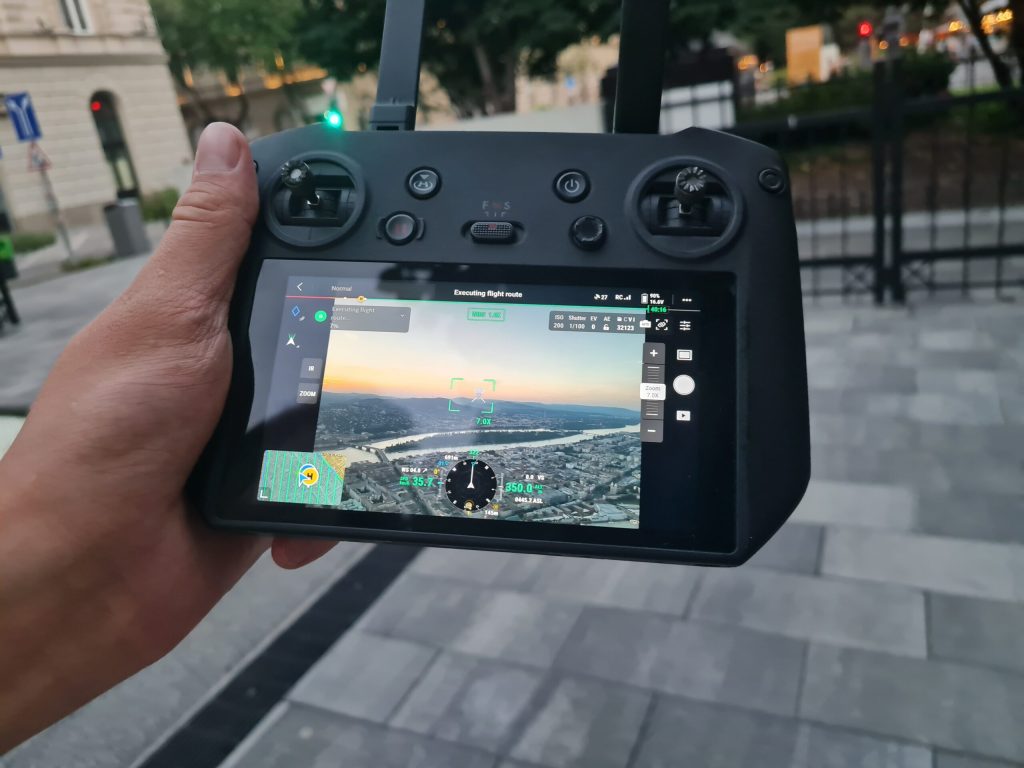
- Altitude: 350 m AGL – the sweet spot between wide swath (≈ 46 cm / px in thermal) and legal ceiling.
- Assets:
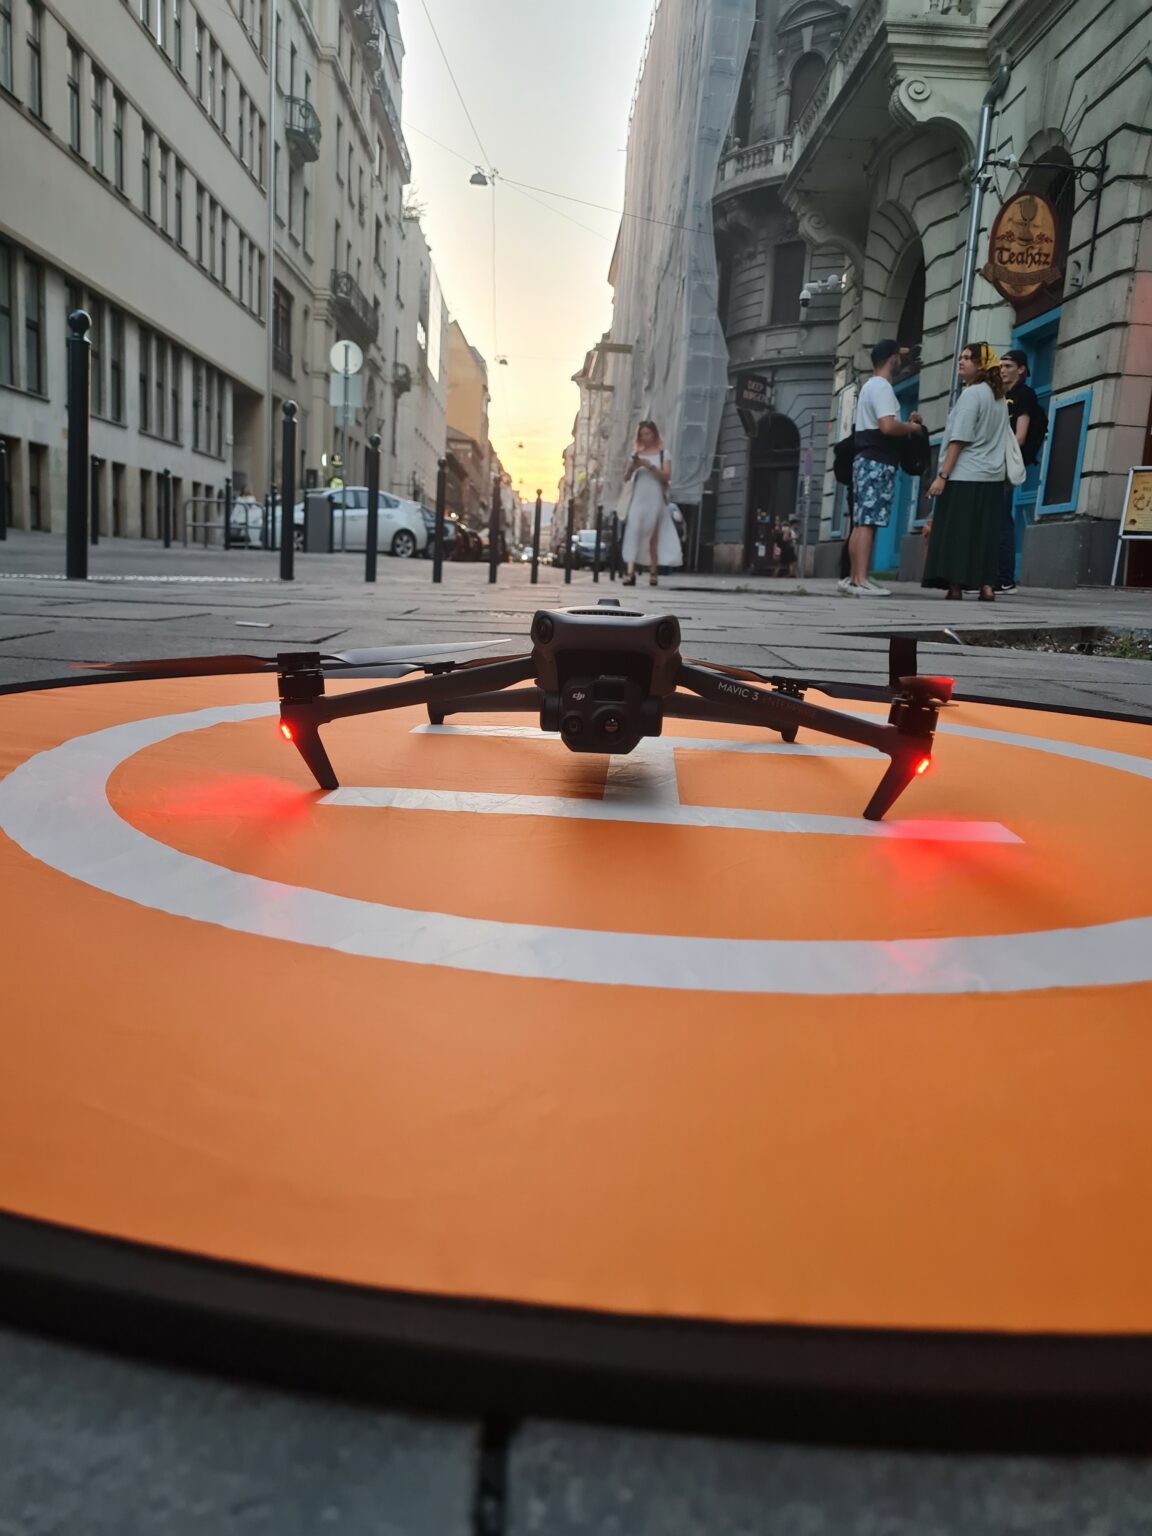
- Thermal: DJI Mavic 3 Thermal, 640 × 512 px, 46 cm / px ground sampling distance, ±2 °C.
- Reference RGB: DJI Mavic 2 Pro, 20 MP, 6.8 cm / px.
- Coverage: The entire administrative boundary of District VI (Terézváros) and VII (Erzsébetváros)
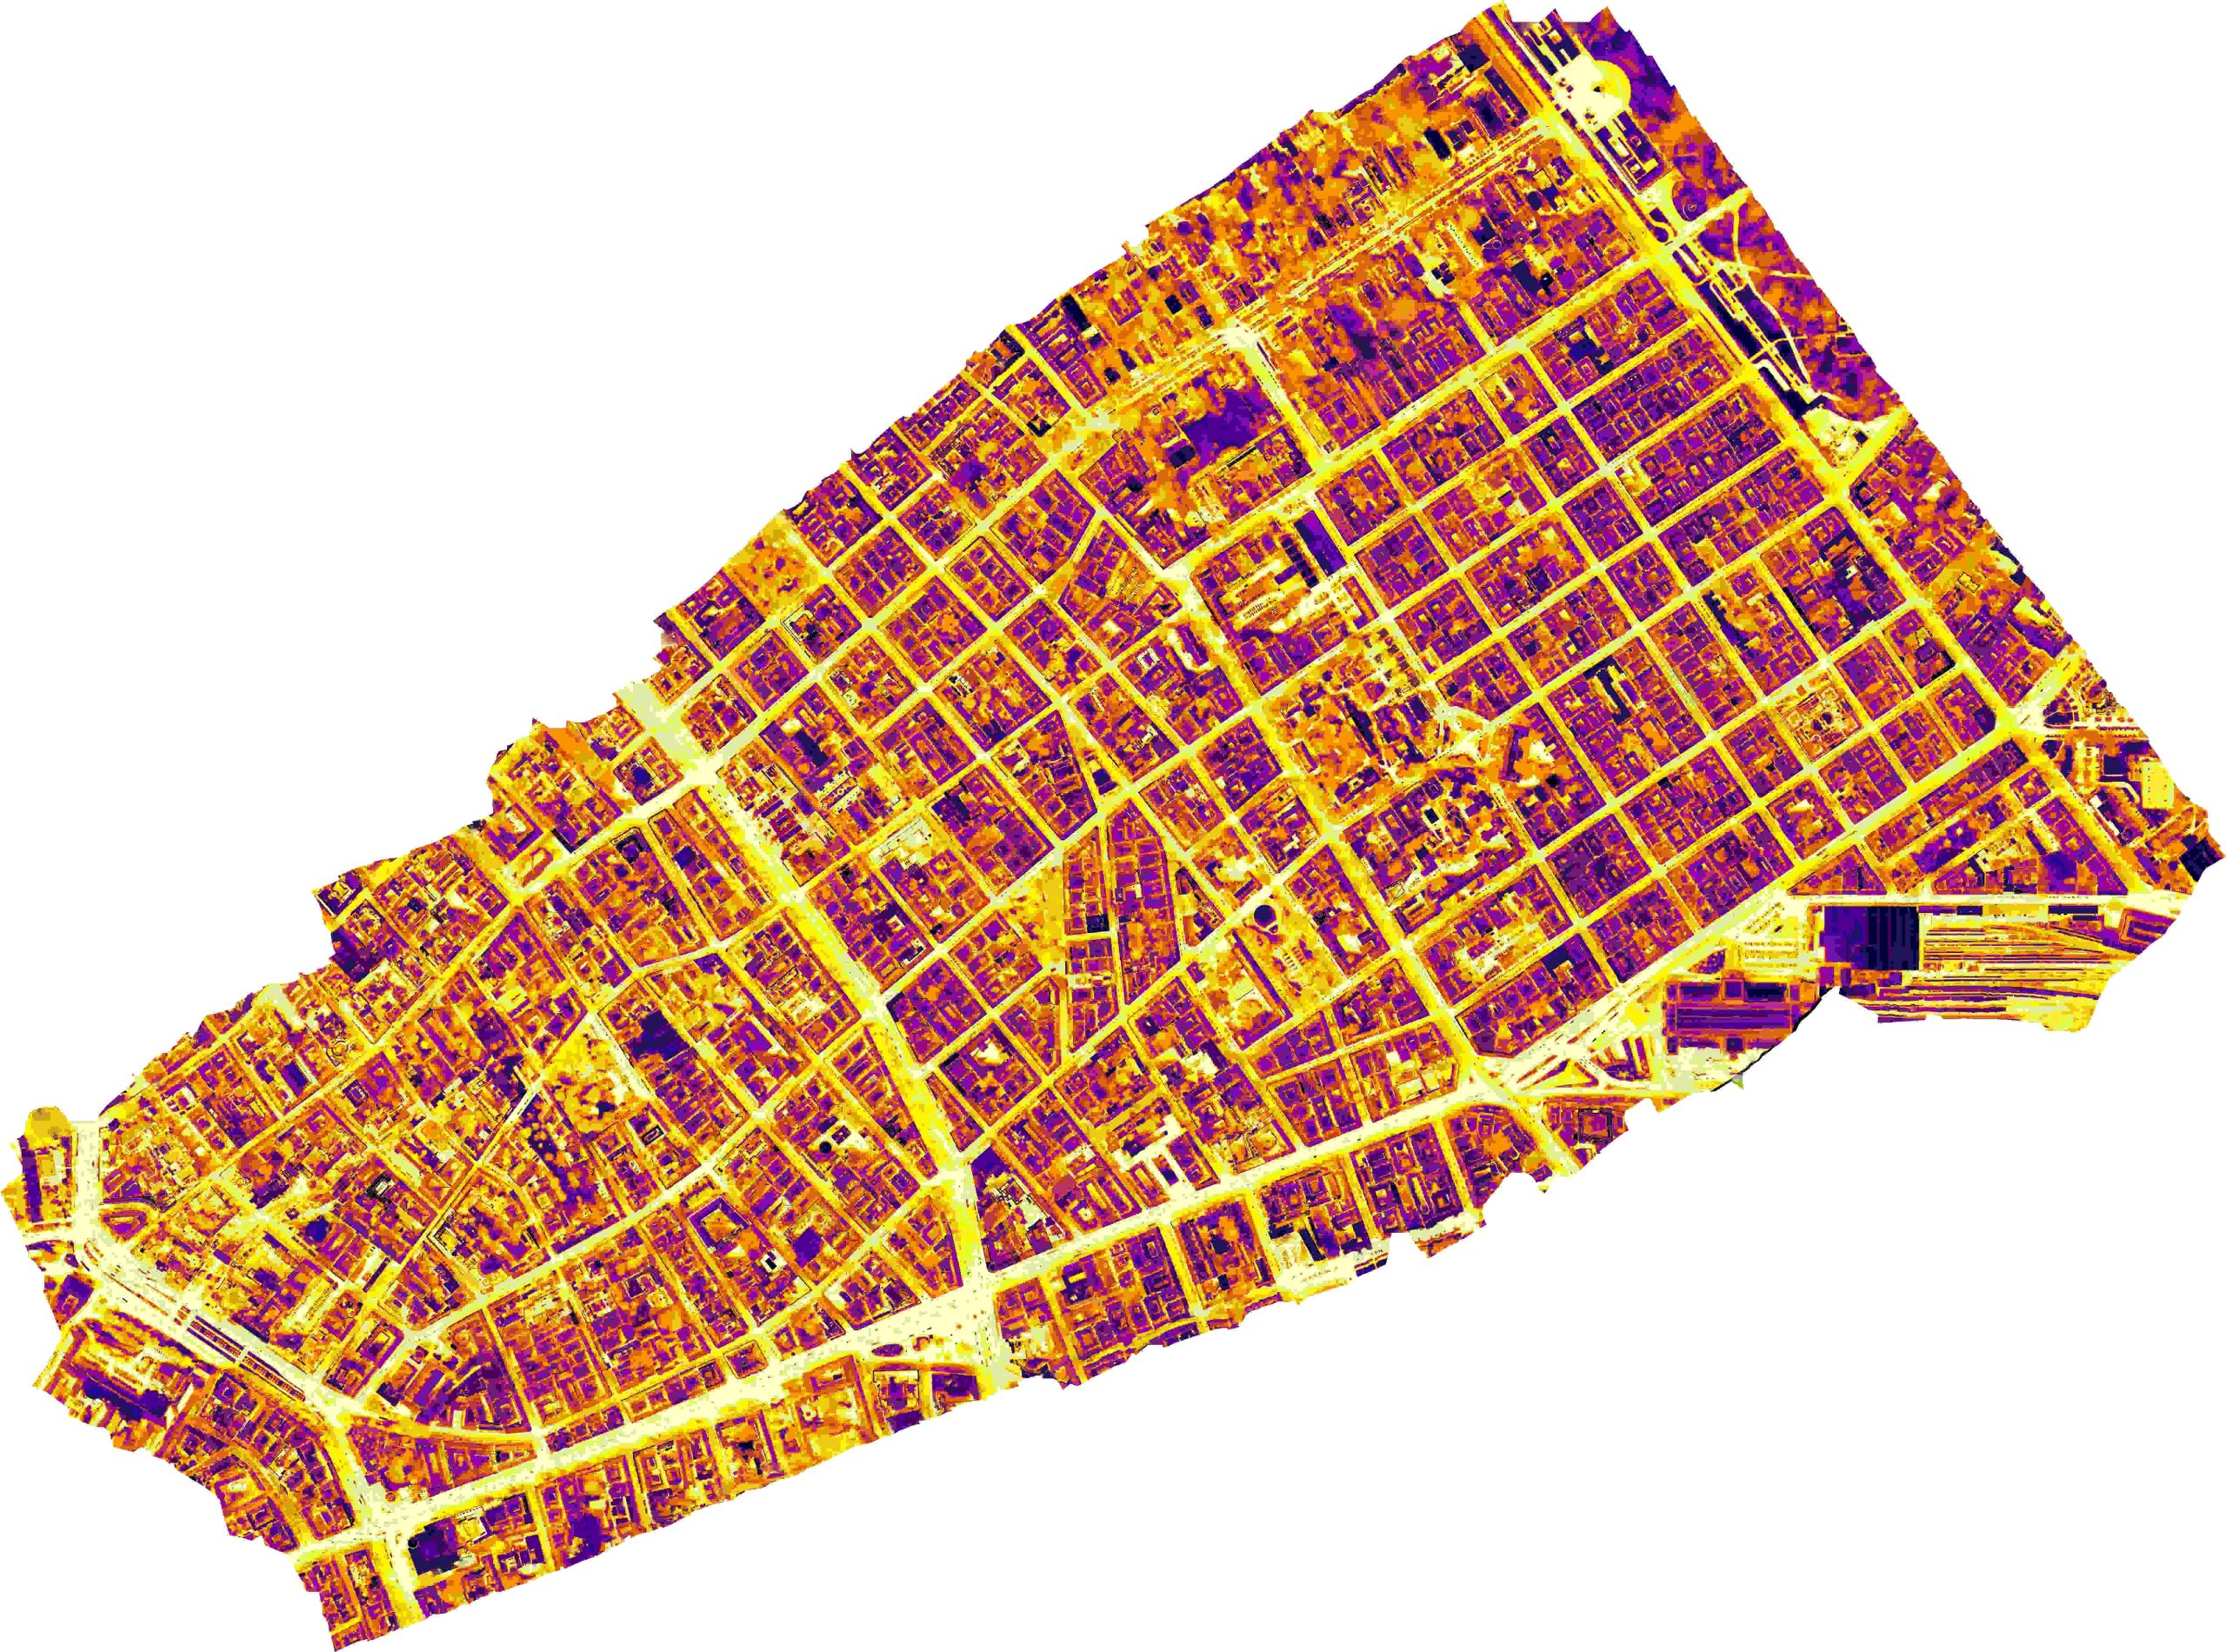
All 824 radiometric frames from the DJI Mavic 3 Thermal and the companion 434 RGB frames from the Mavic 2 Pro were first radiometrically-corrected and aligned, then stitched in Agisoft/Pix4D into two georeferenced orthomosaics. The thermal mosaic was exported as a 16-bit GeoTIFF (ground-sampling distance ≈ 46.4 cm / px, calibrated –20 °C … +150 °C, accuracy ±2 °C), while the visual mosaic was delivered as a 32-bit RGB GeoTIFF at 7.05 cm / px. Both rasters share the same EPSG-23700 project grid, so they can be stacked without reprojection.
The orthomosaics for both districts studied are available for public use in the Maps section of the website. Researchers requiring raw sensor data can find this in the APPs section,
This thermal data can also be used to analyse residential thermal comfort; for example, it can be used to calculate the Human Comfort Index (HCI), which helps us to understand personal heat stress.
Furthermore, thermal data can be processed using machine learning, visual analytics, and geostatistical
methods, which reveal spatial patterns in heat distribution and can automatically identify hidden heat bridges or heat source anomalies, for example.